Coastal
Our coastal program was established in 2005. We conduct scientific investigations into coastal issues in the Pontchartrain Basin to inform advocacy for coastal restoration initiatives and to ensure the sustainability of coastal ecosystems for future generations.
Coastal Projects
The Coastal Program conducts many projects around the basin, including scientific studies, restoration projects and long-term analysis. PC partners with many agencies, NGOs and universities to study, plan and implement projects that protect all of our citizens from future storms and to keep our coastal region economically and culturally sustainable for the future.
Mardi Gras Pass
Mardi Gras Pass
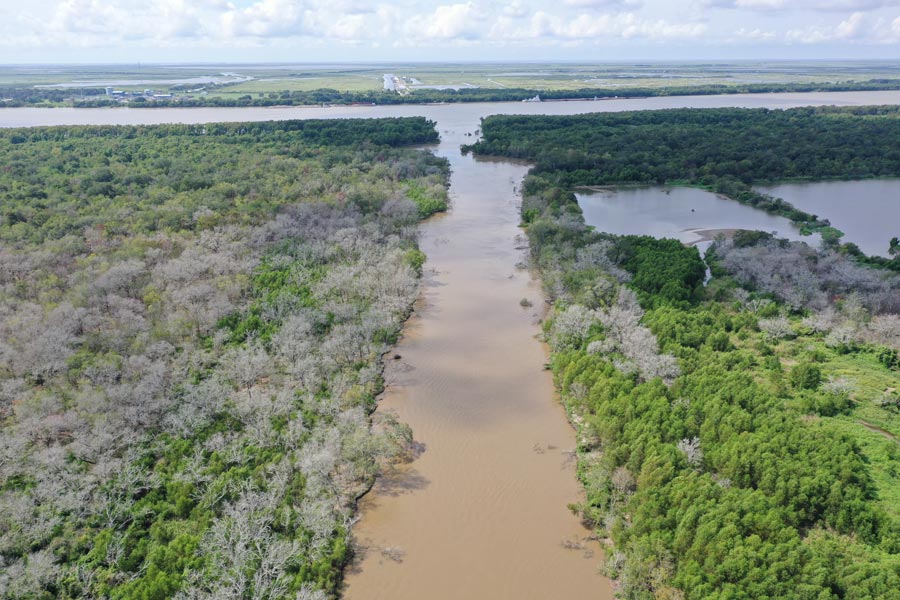
Mardi Gras Pass is located in the Bohemia Spillway about 35 miles southeast of New Orleans at river mile 43.7. The pass began to develop during the 2011 Mississippi River flood when a small crevasse opened along the crest of the natural levee. This created a new channel, evolving through the natural forces of river flow. Headward erosion along the river across a forested bar allowed the channel to entirely breach to the Mississippi River in late February and early March 2012, at which time it was named Mardi Gras Pass. Mardi Gras Pass is now a free-flowing distributary of the Mississippi River.
Learn More
Why Study Mardi Gras Pass?
Mardi Gras Pass offers an opportunity to study the development of a new distributary of the Mississippi River over time. Because most of the Mississippi River is leveed, there is little opportunity for the development of new distributaries. The Bohemia Spillway, where the Pass is located, had its levees removed in 1926, which allowed for the development of Mardi Gras Pass over 80 years later. Additionally, Mardi Gras Pass allows us to observe the pattern of distribution of freshwater, sediment and nutrients into the basin.
PC's Research
PC studies the changing channel dimensions caused by the water flowing through the pass from the Mississippi River. The introduction of the Mississippi River has brought in sediment to build new wetlands which has now been colonized with new growth of grasses and trees.
Results
So far, we have reached a few major conclusions about the pass although we continue to study it. Freshwater discharge has increased over time which allows more water flow. Growth in sediment deposits have increased and pioneer grasses and trees have taken root. Lastly, we know that many species of saltwater and freshwater fish are using the pass as well as mammals, birds, reptiles and crustaceans.
Bohemia Spillway
Bohemia Spillway
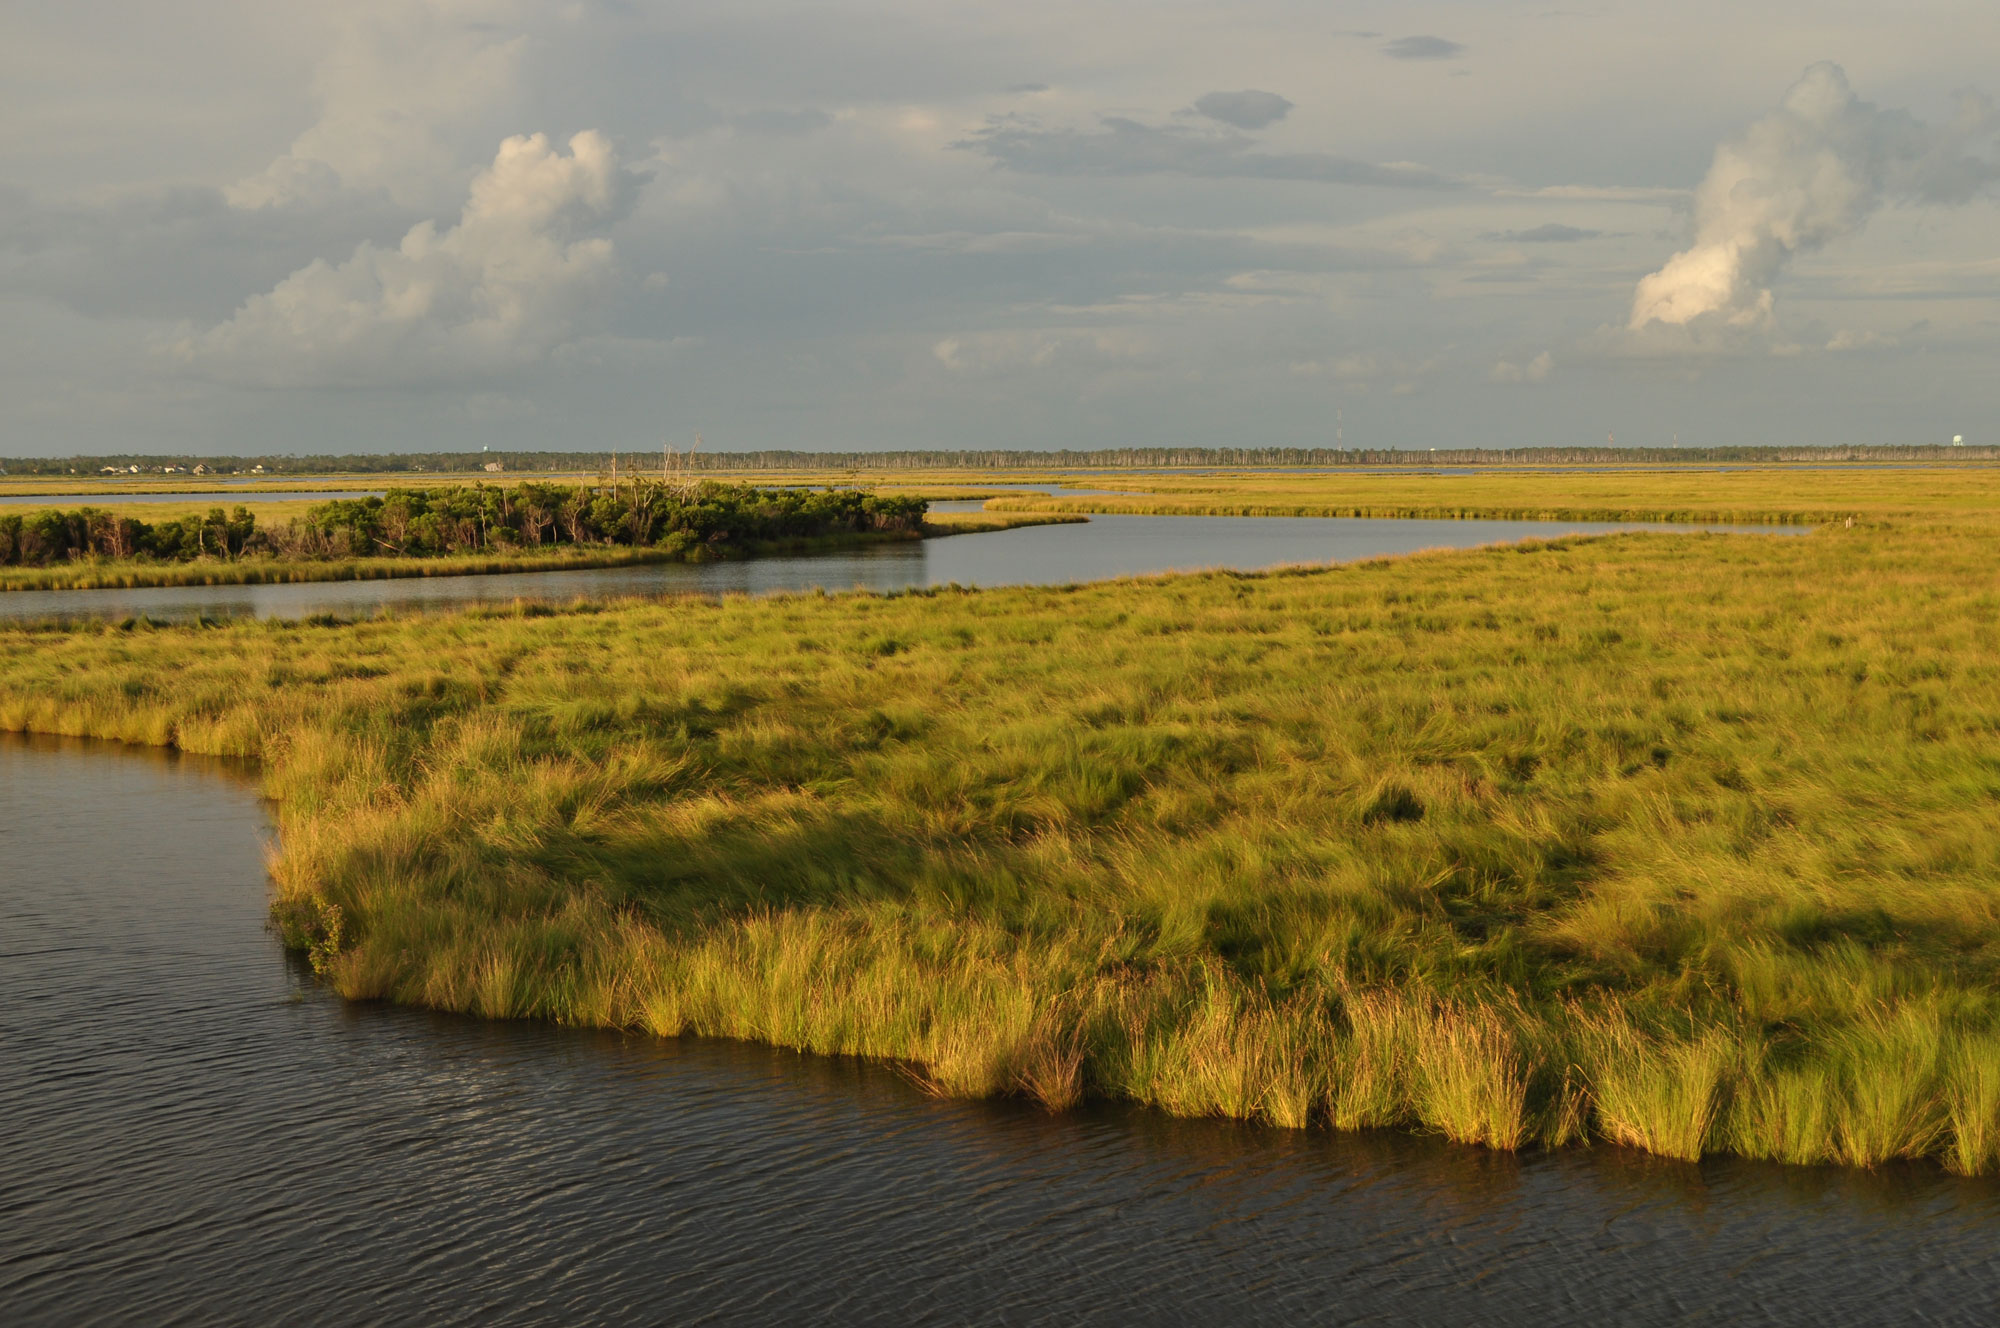
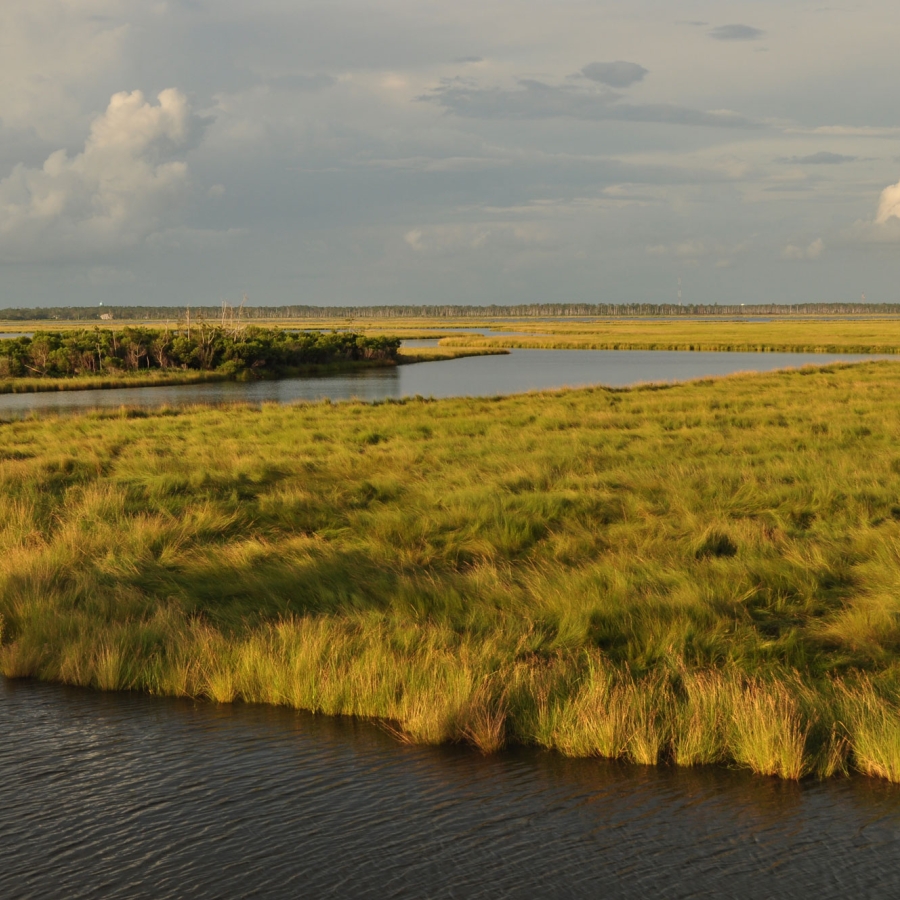
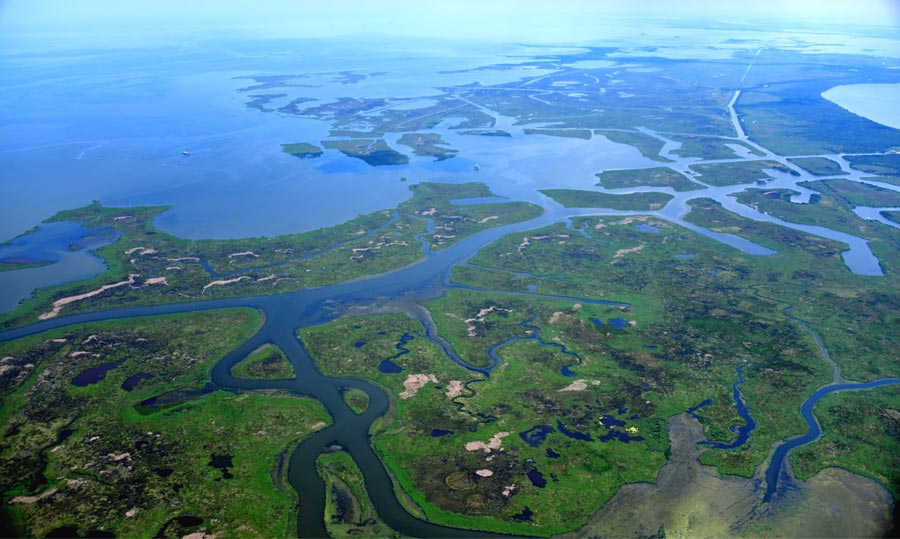
The Bohemia Spillway is located in Plaquemines Parish on the east bank of the Mississippi River about 35 miles southeast of New Orleans, LA. In the 1920’s Mississippi River stages at New Orleans were becoming higher and more threatening, and so the Bohemia Spillway was authorized in 1924 by the Louisiana State legislature for the purpose of creating a river flood relief outlet and reducing flood risk to New Orleans. Since 1926, the natural levee of the Bohemia Spillway has been periodically overtopped during flood events on the Mississippi River.
Learn More
Why Study the Bohemia Spillway?
Studying the Bohemia Spillway offers an opportunity to observe natural processes at work. While current conditions of the river and the receiving basin have changed over time, the Bohemia Spillway still offers a glimpse into the past of the way the river may have operated before human intervention. It also offers a glimpse at the historical interaction between the river and the wetlands before the river levees were built. The spillway also allows us to see the effects of overbank flow on wetlands, which could inform future operation of river diversions.
PC Research Program
PC has been investigating the spillway since 2007. Primarily we have studied periodic flooding, land loss and land gain, land elevation changes, and vegetation surveys. We also conducted extensive research during the 2011 Mississippi River flood.
Results
During the 2011 Mississippi River flood survey we saw that overtopping waters were captured quickly by small natural channels and gullies shortly after the water overtopped the natural levee. Little overland flow was observed, relegated to the forest found along the natural levee and not reaching the adjacent marshes.
Our land loss analysis from 1932 to 2010 showed that there have been low land loss rates in the spillway since 1975. The Bohemia Spillway does not seem to suffer the same interior land loss as other parts of the coast. This stability may be the result of periodic pulses of water and sediment received from the Mississippi River during flood events but could also be due to underlying geology, or a combination of the two.
Canals in the Bohemia Spillway are being reclaimed by infilling. This is a rare occurrence in southeast Louisiana where canals usually expand and contribute to interior marsh loss. Through our observations and study, we have concluded that the pulsed flow from the Mississippi River in flood years since 1926 has contributed to the sustainability and resiliency of marshes in the Bohemia Spillway.
Habitat Restoration
Bayou St. John Urban Marsh
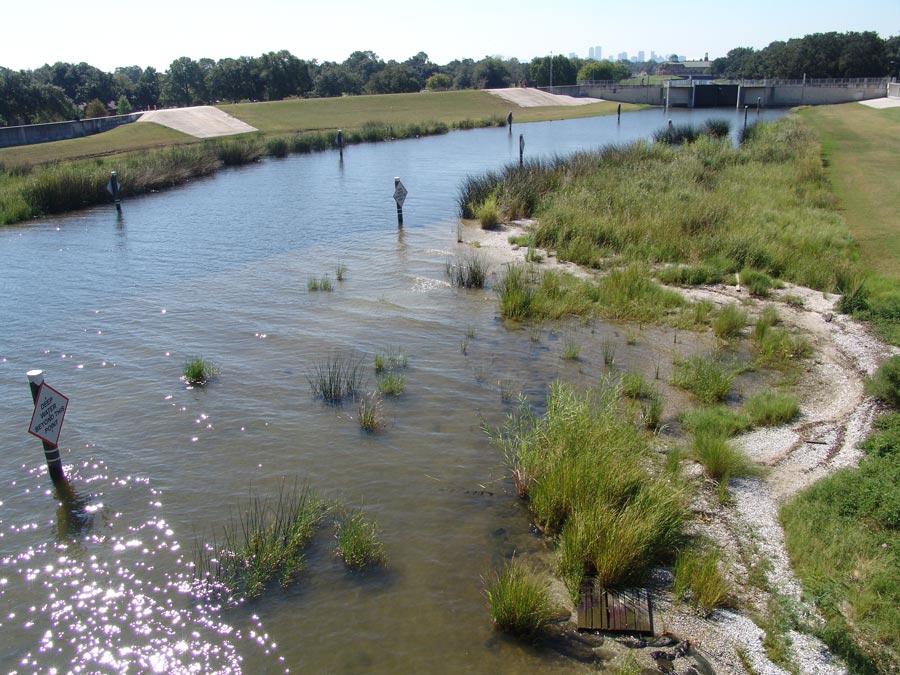
The Bayou St. John Urban Marsh was established in 2013 just inside the Lakeshore Drive bridge. The removal of a nearby dam by Louisiana Department of Wildlife and Fisheries offered the opportunity to improve the health of the waterway through the creation of this marsh. Seven native marsh grasses were planted to begin a pocket of native habitat in the bayou and improve the water quality before it empties into Lake Pontchartrain.
Learn More
By creating this native habitat, the Bayou St. John Urban Marsh:
- Creates habitat for fish, crab and waterfowl
- Improves fishing, bird watching and recreational value
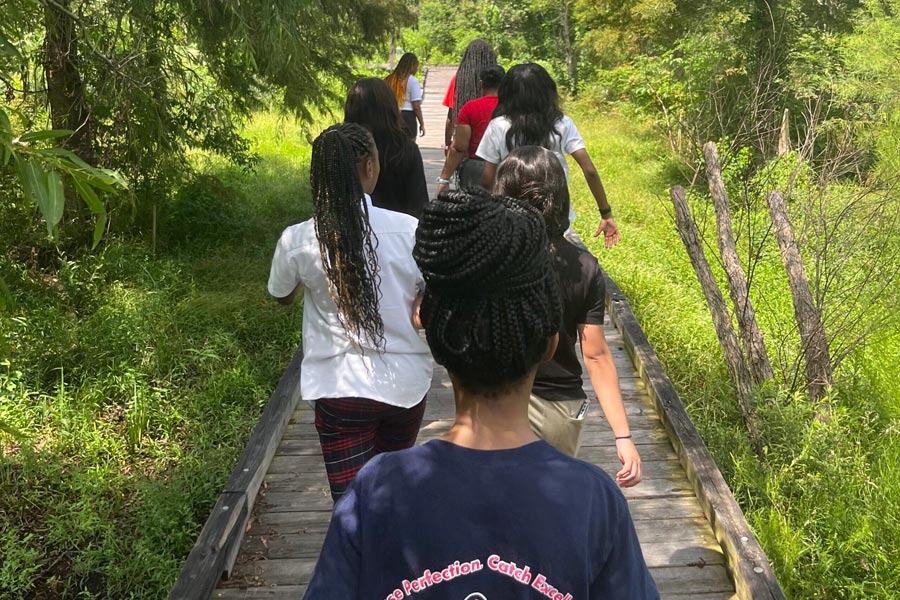
- Provides a living classroom for experiencing nature in an urban area
- Enhances the historic waterway and the Lafitte Corridor
- Demonstrates nature-based solutions that can help restore the Louisiana coast
- Improves water quality of the bayou
- Protects bulkhead and levee from erosion
Conclusions
The creation of the BSJ Urban Marsh has been a success; the marsh is resilient and functioning as intended. We met the goal of re-establishing fringing marsh habitat along the south shore of Lake Pontchartrain, even if at a small scale. Located in a highly urbanized environment, this marsh is a place people can enjoy and learn about wetlands. People are fishing and birding near the marsh, plants are colonizing the marsh and animals find precious refuge, habitat and food there. The BSJ Urban Marsh is one in a small chain of created, restored or remnant marshes fringing the south shore of Lake Pontchartrain that includes the Lincoln Beach marshes, Bucktown Mitigation Marsh, Lake Villa Pond, the Kenner Boat Launch marsh and LaBranche Wetlands. Conserving, restoring and creating these types of habitats establishes lost habitat and contributes to storm protection. BSJ Urban Marsh can be a model for how to create wetlands in high energy environments.
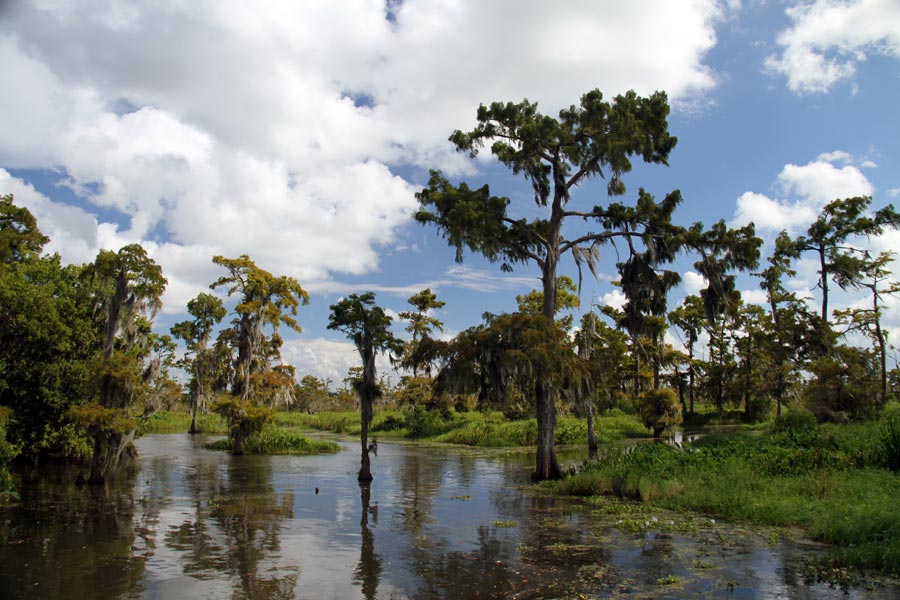
Maurepas Land Bridge
Maurepas Land Bridge
The Maurepas Land Bridge is a critical line of defense in reducing risk from storm surge for communities around Lake Maurepas as well as East Baton Rouge. Historically, the land bridge was covered with swamp forest dominated by bald cypress trees. The entire land bridge was clear cut in the late 1800’s and early 1900’s when logging of cypress peaked in the region. The construction of the MRGO (Mississippi River-Gulf Outlet), which introduced higher salinity to Lakes Pontchartrain and Maurepas, also had an effect on the remaining cypress stands.
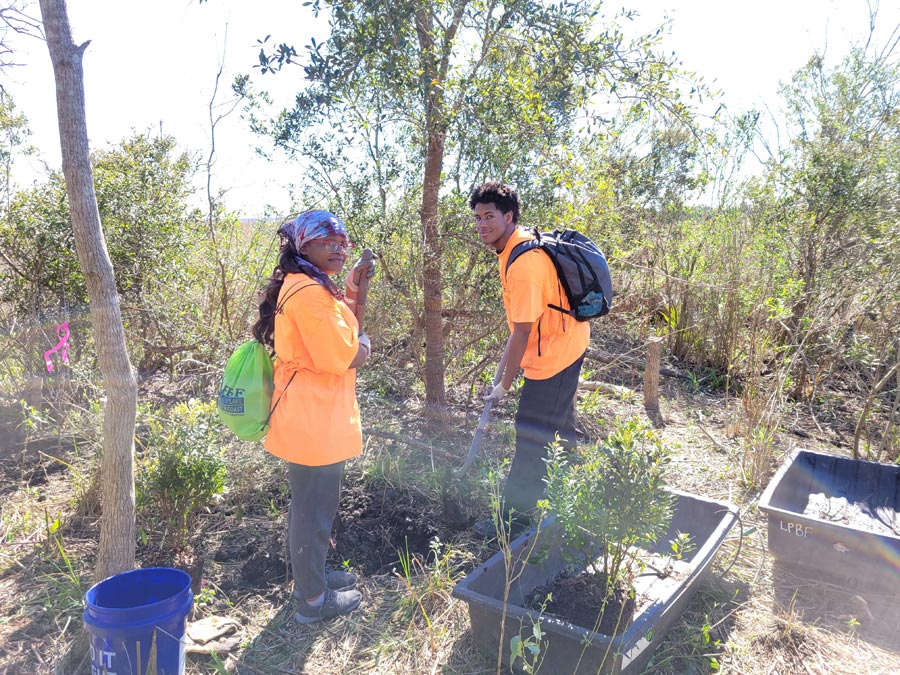
PC has begun a planting program on the Maurepas Landbridge modeled after our program at the Caernarvon Freshwater Diversion. The goal is to contribute to large-scale, long-term restoration in the Pontchartrain Basin. If successful, this swamp reforestation could restore wildlife habitat and reduce storm surge for the surrounding communities.
PC has begun a planting program on the Maurepas Landbridge modeled after our program at the Caernarvon Freshwater Diversion. The goal is to contribute to large-scale, long-term restoration in the Pontchartrain Basin. If successful, this swamp reforestation could restore wildlife habitat and reduce storm surge for the surrounding communities.
Learn More
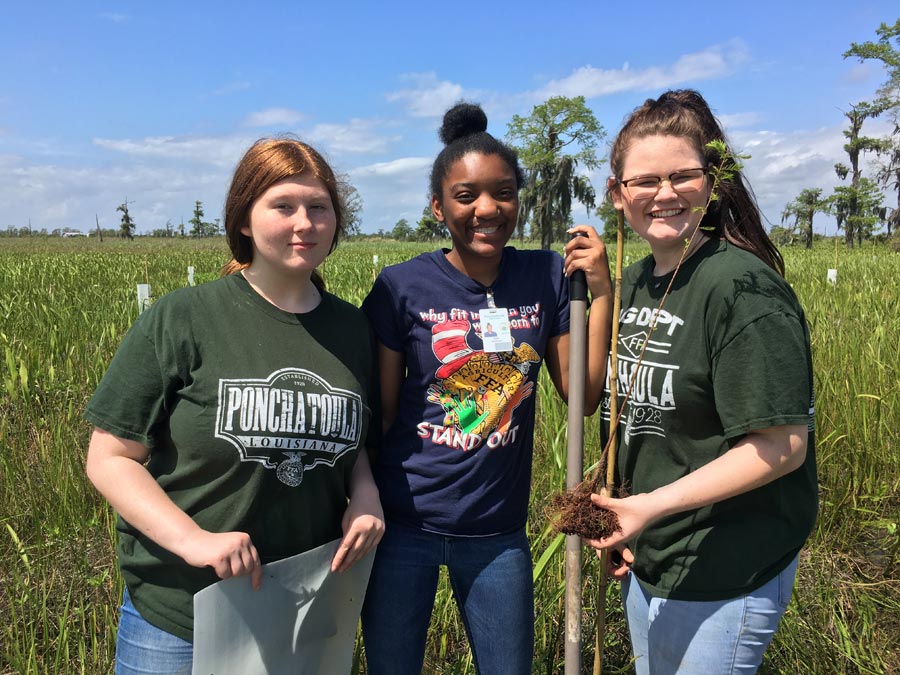
Planned Swamp Restoration on the Maurepas Landbridge
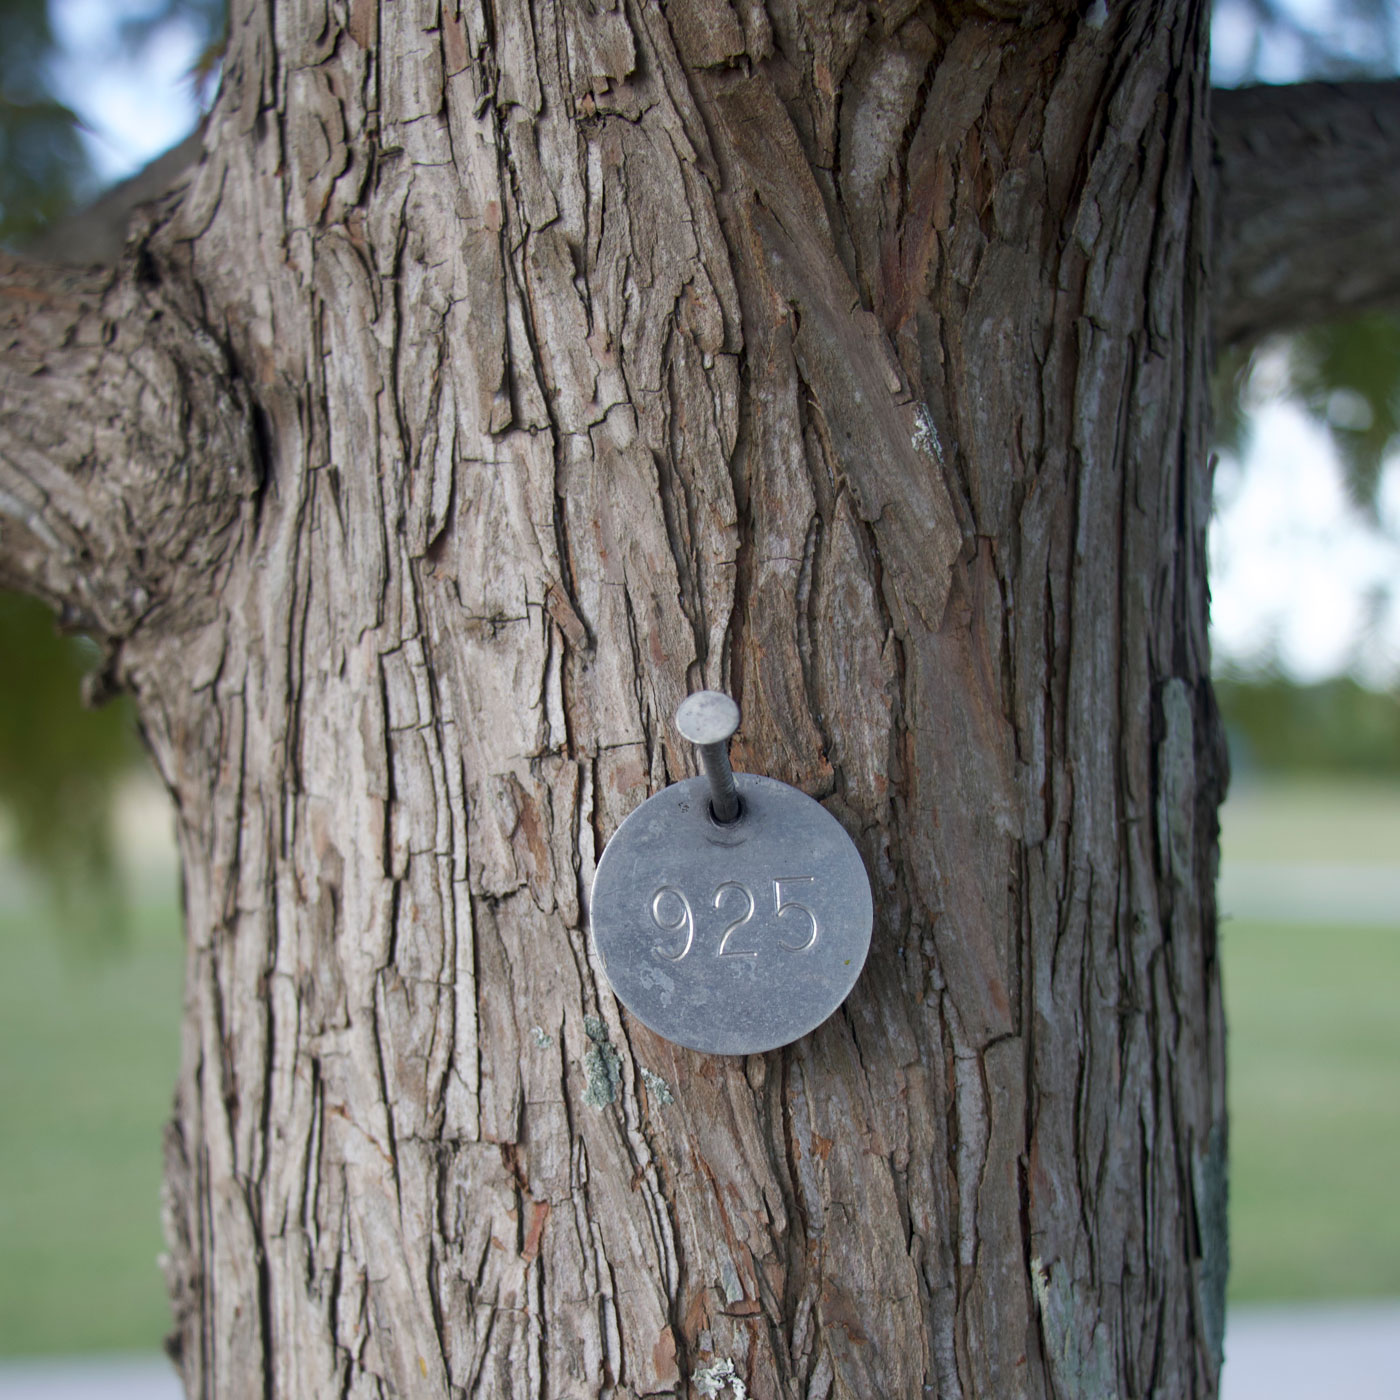
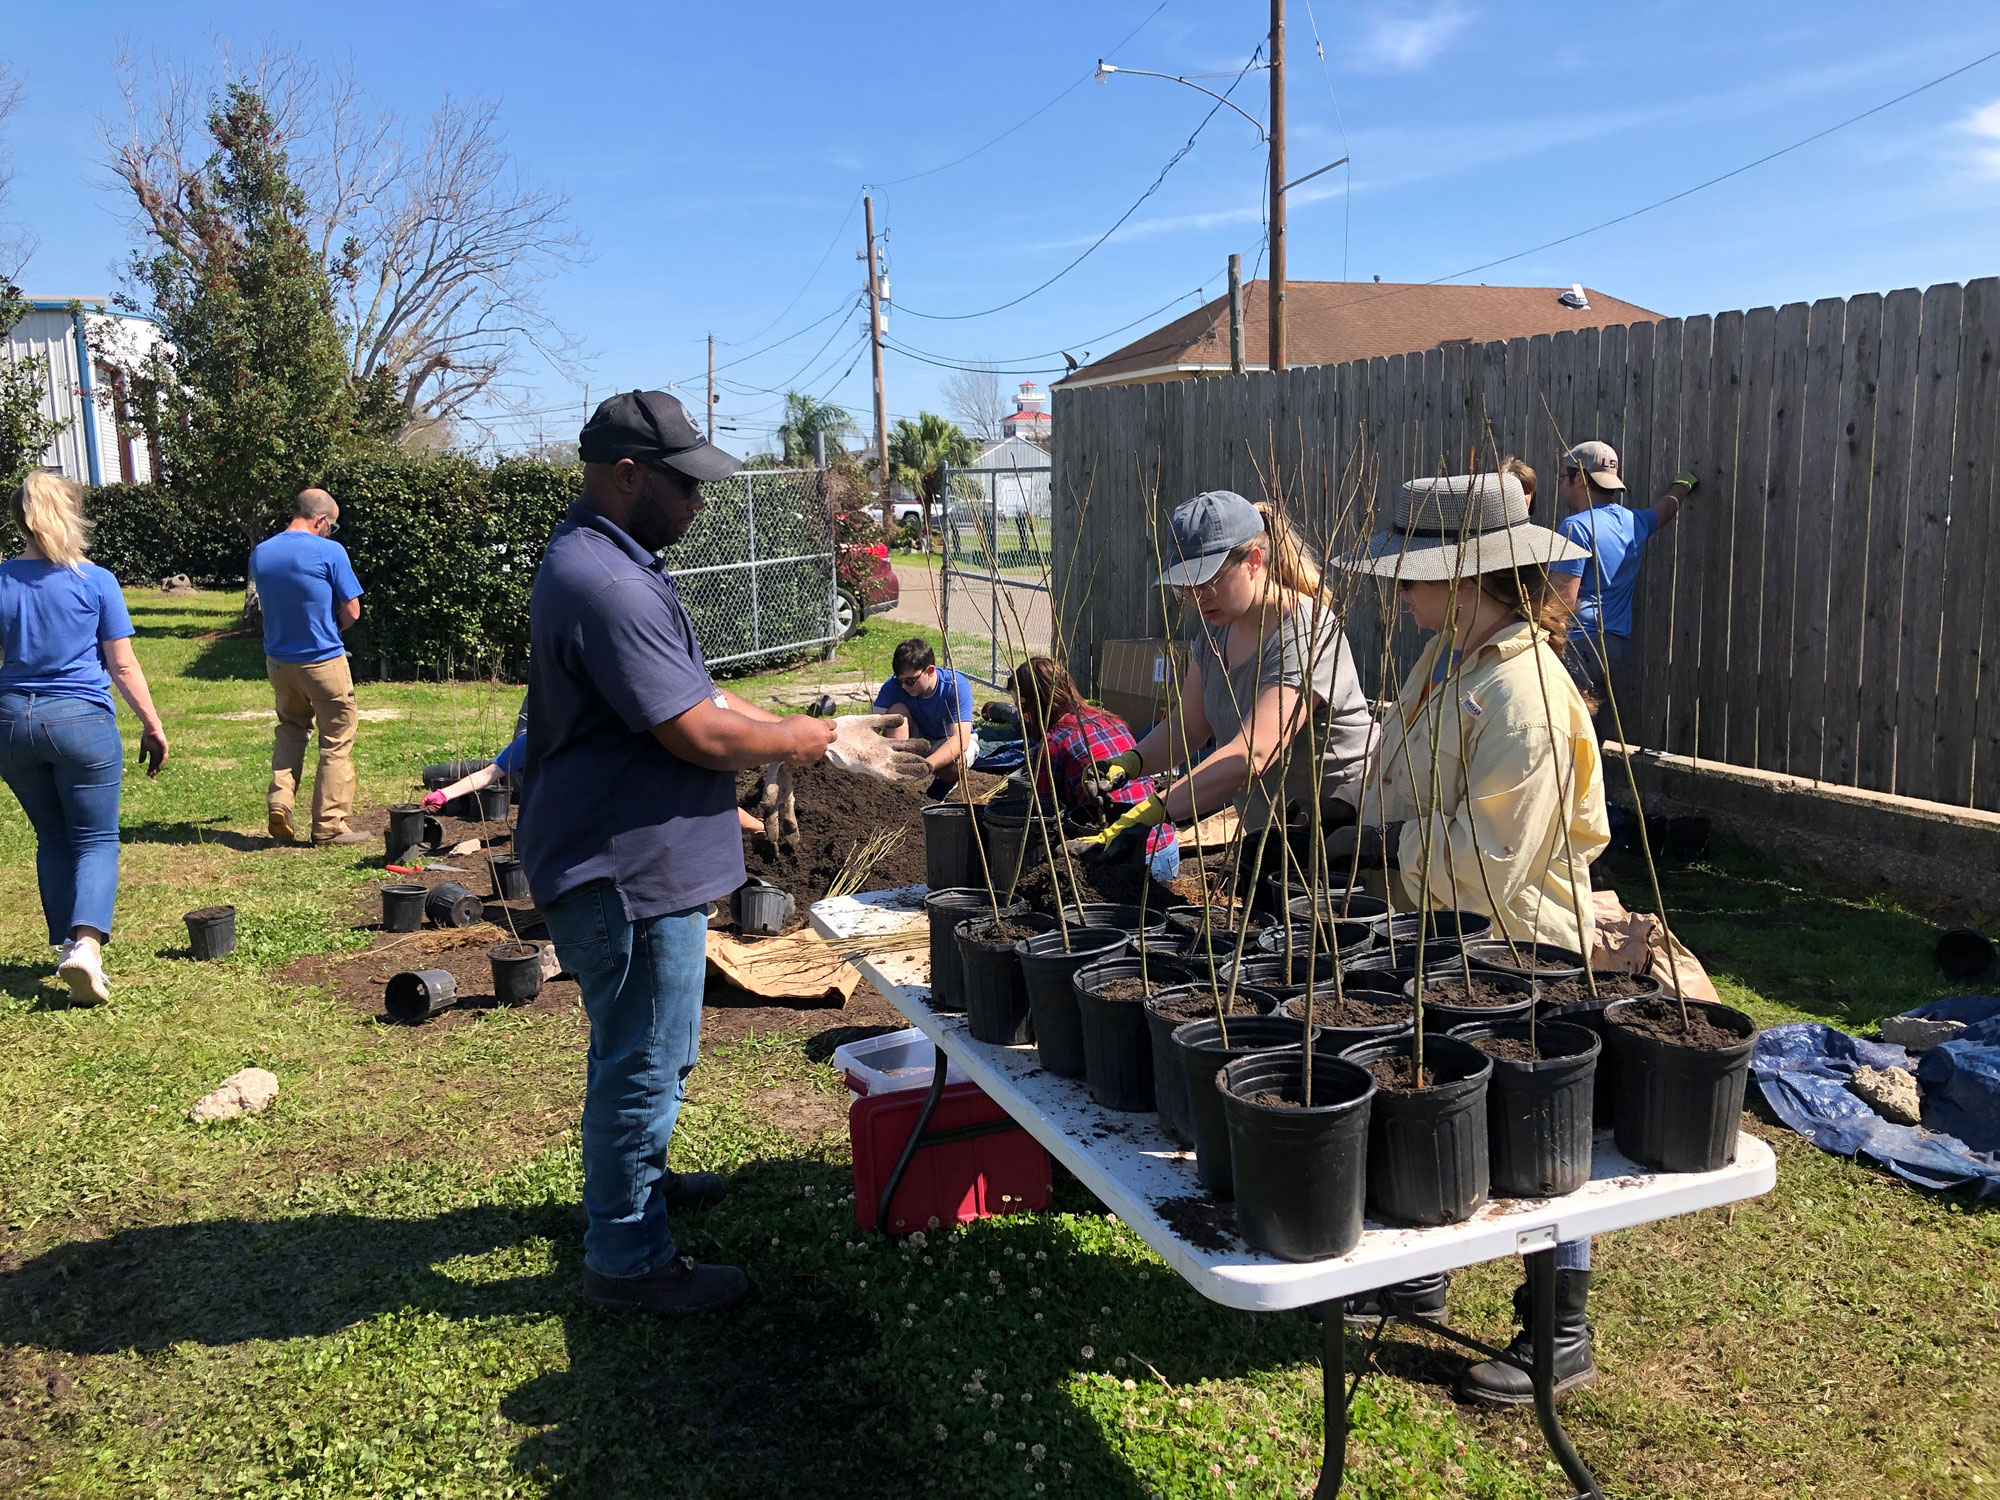
PC has conducted various swamp tree plantings on the Maurepas Landbridge since 2013 with the help of many dedicated community volunteers. We have planted thousands of trees, most of which are surviving and already providing valuable habitat. Data gathered from monitoring these trees has provided lessons for improving the success of subsequent planting programs.
Natural Swamp Regeneration
In 2015, we noted a large swath of the land bridge where natural swamp regeneration seems to be underway. To determine if natural regeneration is occurring, PC set up a study that investigated the extent and density of natural swamp regeneration in the Maurepas land bridge.
Results
Over 600 trees comprised the sample for the regeneration study. The species composition, in general, consisted of many small individuals of red maple and green ash, medium sized individuals of black willow and black gum and larger individuals of water tupelo and bald cypress. However, bald cypress was found across a range of sizes with both small and large individuals present. In general, there was a trend of more individuals and more species found at lower soil salinity.
Although this data set is limited, it does suggest that the swamp forest on the Maurepas Land Bridge is in the beginning stages of natural regeneration. The future of natural regeneration in the region is uncertain but there are a few factors that increase the chances of success. The closure of the MRGO (Mississippi River-Gulf Outlet) has decreased both the surface and soil salinity in the region, and salinity fluctuations have decreased. Over time, the continuation of this study will reveal the dynamics of natural swamp regeneration, including shifts in species composition, mortality, and the next generation of saplings that would become the future tree canopy.
Although this data set is limited, it does suggest that the swamp forest on the Maurepas Land Bridge is in the beginning stages of natural regeneration. The future of natural regeneration in the region is uncertain but there are a few factors that increase the chances of success. The closure of the MRGO (Mississippi River-Gulf Outlet) has decreased both the surface and soil salinity in the region, and salinity fluctuations have decreased. Over time, the continuation of this study will reveal the dynamics of natural swamp regeneration, including shifts in species composition, mortality, and the next generation of saplings that would become the future tree canopy.
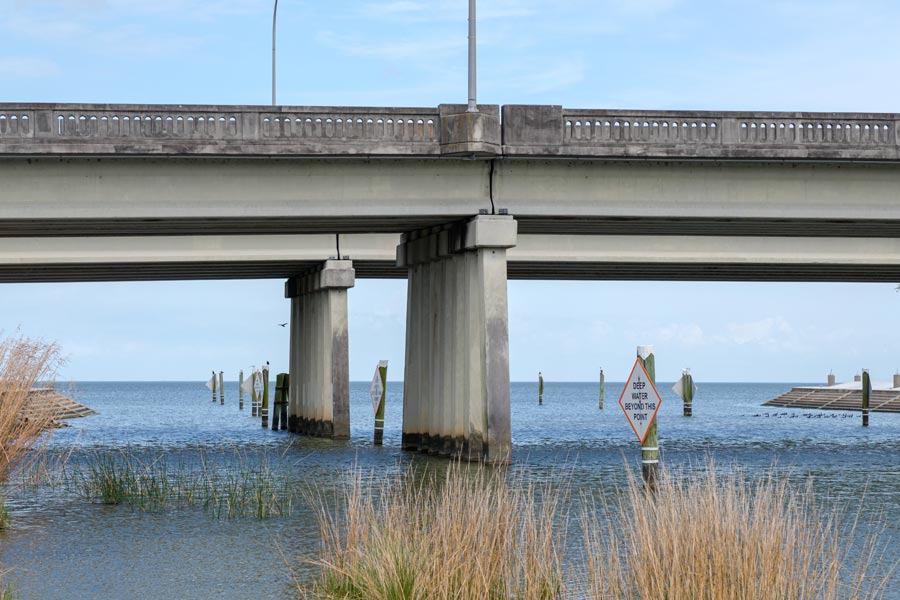
Central Wetlands
Central Wetlands
The Central Wetlands are a 29,140-acre semi-impounded wetland, located in Orleans and St. Bernard Parishes. It is bordered by the Mississippi River Gulf Outlet (MRGO, now closed) and the Hurricane and Storm Damage Risk Reduction System (HSDRRS) Levee to the east and the 40 Arpent Levee and Canal to the west.
Prior to European settlement, the Central Wetlands was made up of a combination of bald cypress and water tupelo swamp, fresh marsh and bottomland hardwood forest. This provided natural storm surge protection for the people of New Orleans. Currently, the Central Wetlands is a mosaic of wetland habitats that range from relatively healthy with stable soil and dense vegetation to open water and ghost swamps. The Central Wetlands are subject to influences inside and outside the area that can have an effect on water flow and salinity.
Prior to European settlement, the Central Wetlands was made up of a combination of bald cypress and water tupelo swamp, fresh marsh and bottomland hardwood forest. This provided natural storm surge protection for the people of New Orleans. Currently, the Central Wetlands is a mosaic of wetland habitats that range from relatively healthy with stable soil and dense vegetation to open water and ghost swamps. The Central Wetlands are subject to influences inside and outside the area that can have an effect on water flow and salinity.
Learn More
Study of the Central Wetlands
There has been great interest and much conversation about the restoration and effective management of the Central Wetlands since Hurricane Katrina devastated much of the Ninth Ward community and surrounding area. The closure of the MRGO was a solid first step towards hydrologic restoration. An in-depth understanding of the environmental parameters found across the Central Wetlands will allow for more informed planning of restoration activities, which will increase the success and effectiveness of those restoration activities and their impact on the surrounding communities.
Monitoring and Research
PC studied the Central Wetlands by collecting water depth, surface salinity, soil salinity and vegetation data. PC studied the Central Wetlands in order to understand the health of the region and what kinds of restoration are needed, feasible and realistic.
Our findings determined that the Central Wetlands cannot be thought of as one large area under the same influences, and therefore restoration solutions do not apply universally across the entire area. Varying salinities, water depth and vegetation indicate precise and separate areas with different restoration needs.
Our findings determined that the Central Wetlands cannot be thought of as one large area under the same influences, and therefore restoration solutions do not apply universally across the entire area. Varying salinities, water depth and vegetation indicate precise and separate areas with different restoration needs.
Central Wetlands Reforestation Collective
Learn more about our latest work in the Central Wetlands with multiple community partners as CWRC.
Caernarvon
Caernarvon
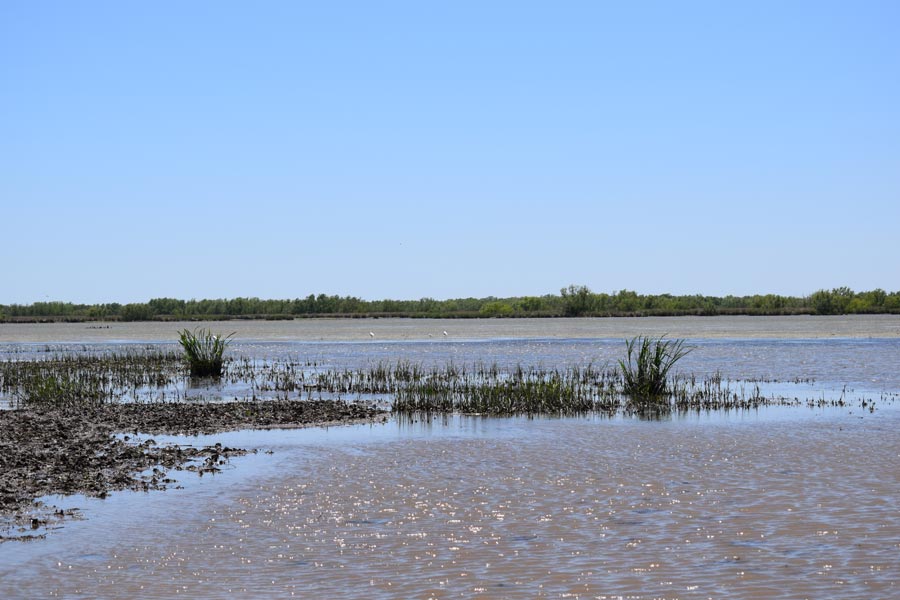
The Caernarvon Freshwater Diversion opened in 1991 and was designed to divert water from the Mississippi River into a local estuary, Big Mar Pond, previously a failed agricultural impoundment. In the years since its construction, the Caernarvon Diversion has deposited significant amounts of sediment into Big Mar, creating emergent wetlands. In 2010, Pontchartrain Conservancy, Restore the Earth Foundation and the Coalition to Restore Coastal Louisiana partnered to provide critical reforestation to this area to stabilize and effectively establish the newly created land.
Learn More
Research Program
Pontchartrain Conservancy has been investigating the growth of a delta complex in Big Mar as a result of the Caernarvon Diversion. After seeing the expansion of land building, we conducted several tree plantings to re-establish a swamp plant community in the area. Our study includes land loss and land gain, vegetation survey and tree growth.
Outcomes
The Caernarvon Diversion has effectively converted what was once brackish, open water in Big Mar to intermediate and freshwater marsh, resulting in an increase in biodiversity and ecosystem services throughout the project area. Since 2005, over 1,148 acres of land have been built because of the diversion. Due to the careful research and selection of planting sites, this project has had an 85-90% success rate of the trees planted.
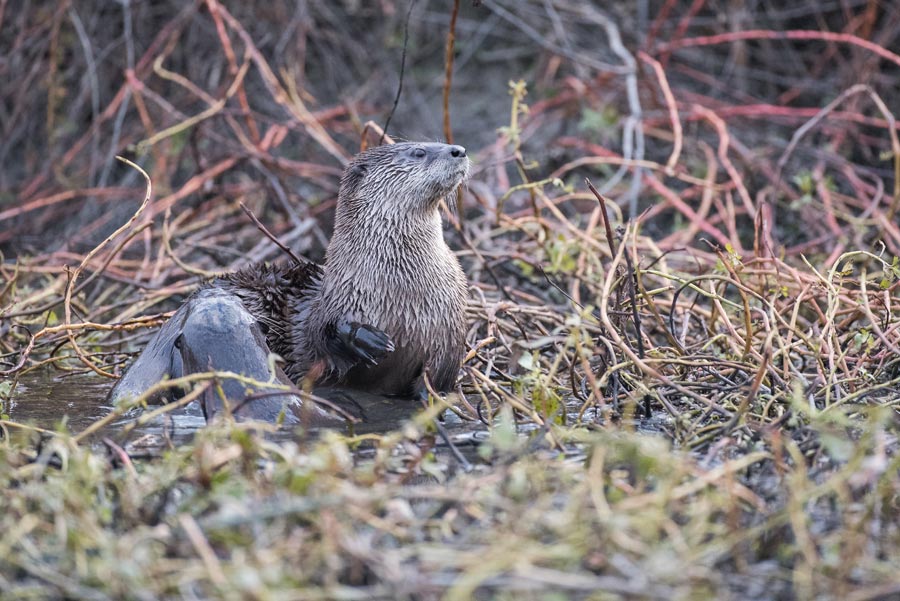
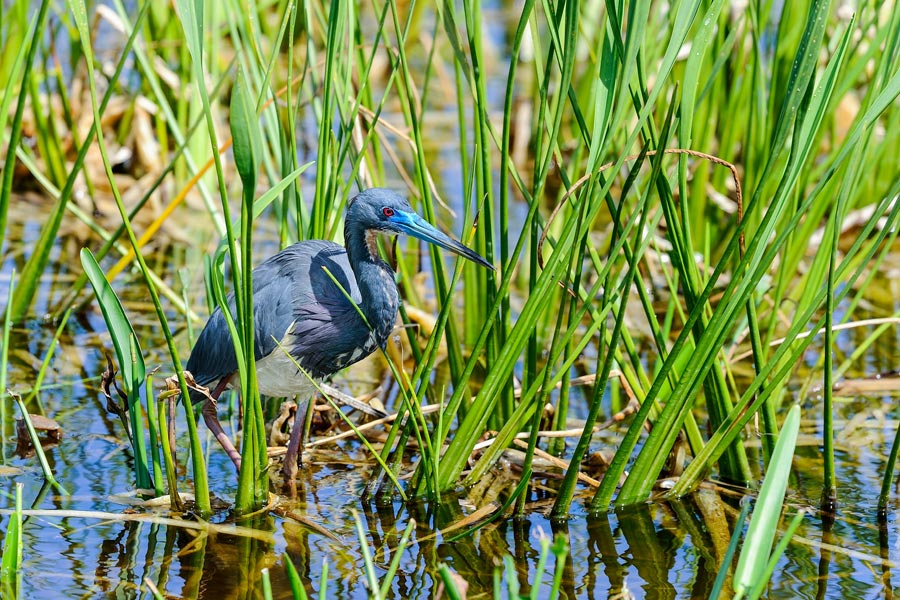
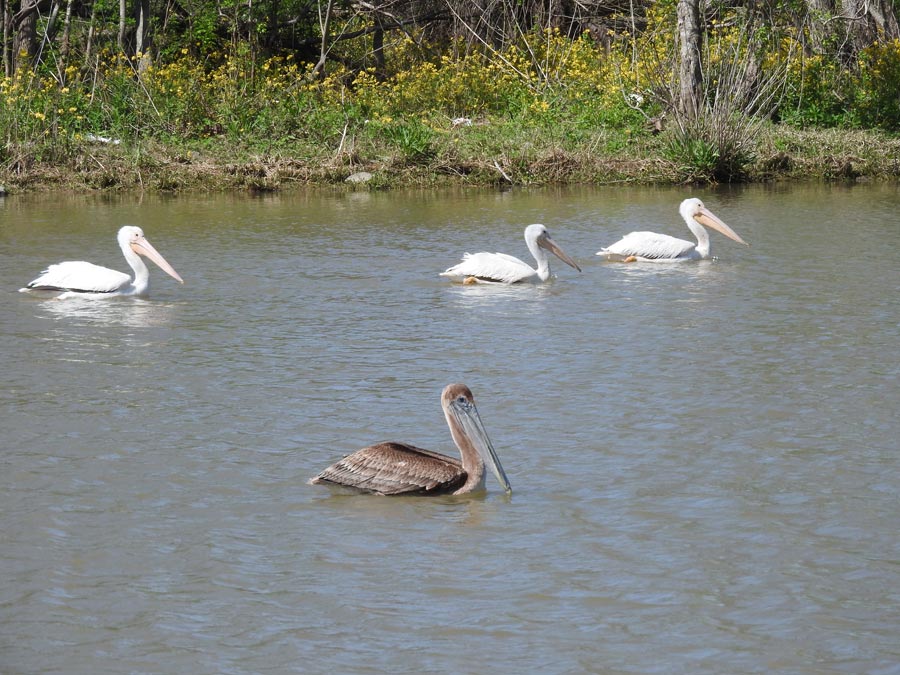
In addition, the intermediate / freshwater marsh provides critical nursery habitat for a variety of coastal species including shrimp, crabs, alligators and fish. The resulting estuarine biodiversity in these freshwater nurseries creates and supports biodiversity further up the food chain, attracting a variety of reptiles and waterfowl which have been observed by land managers and recreational users in the area.
Swamp forest, such as the one reforested and regenerated at Big Mar, is effective in reducing storm surge and buffering wind and wave action. The location of this project is doubly useful as it is adjacent to the levee system.
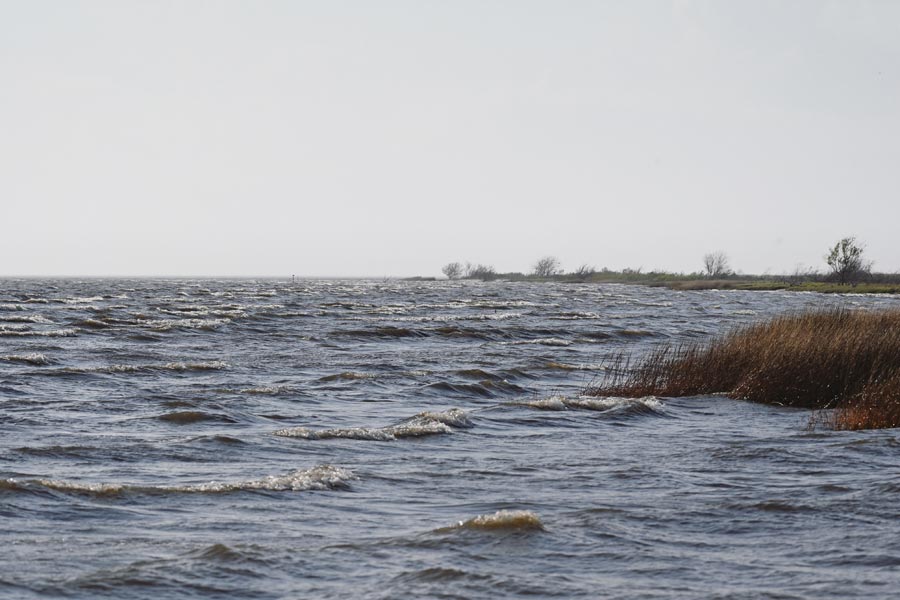
Breton and Chandeleur Sound Hypoxia Study
Breton and Chandeleur Sound Hypoxia Study
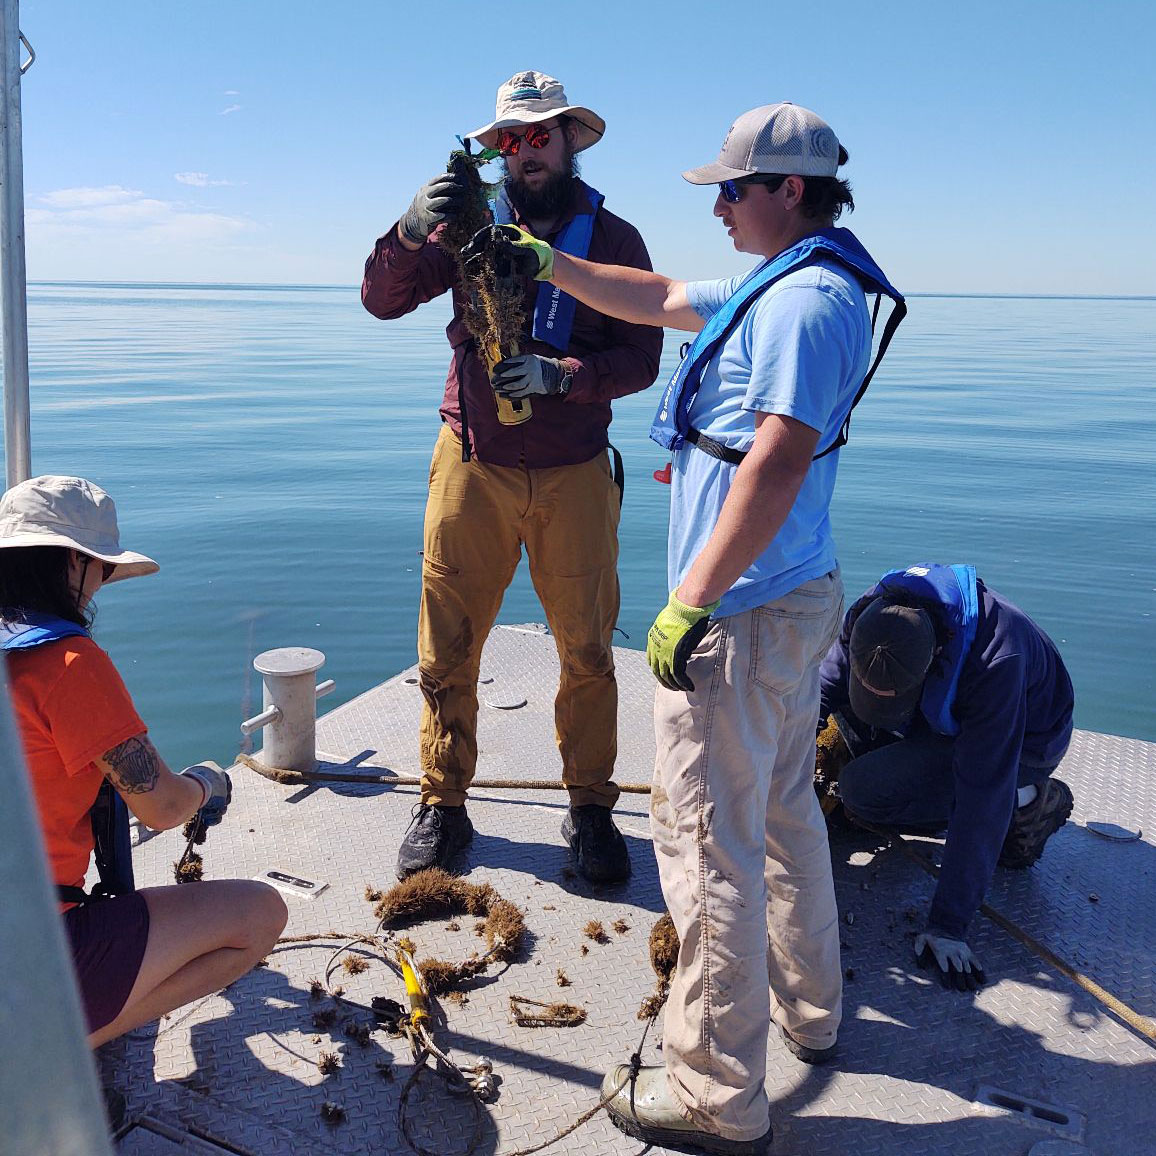
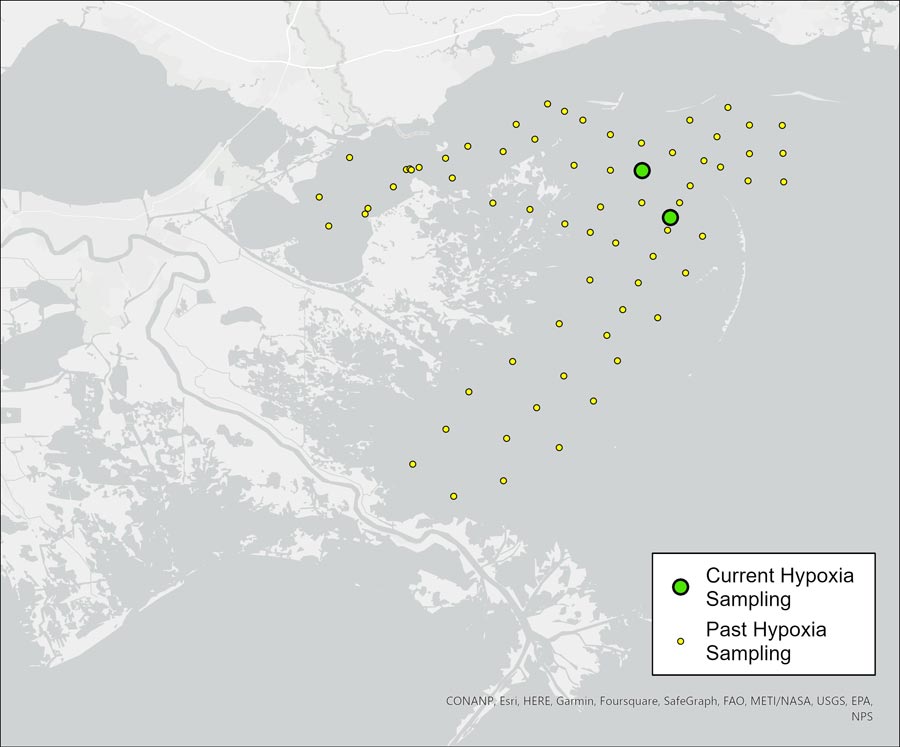
Since 2010, our coastal team has researched areas of hypoxia in the Breton and Chandeleur Sounds. Hypoxia, or low dissolved oxygen, can occur in natural water bodies due to a number of factors. Hypoxic waters can create “dead zones,” where some marine life cannot survive. Researchers hope to determine the cause of hypoxia in these areas in order to find ways to mitigate it in the future.
Learn More
Hypoxic waters are most prevalent along the coast of the United States from late spring through late summer and are becoming more frequent, widespread, and persistent. In southern Louisiana there has been yearly documentation of a dead zone near the mouth of the Mississippi River. This dead zone has been tied to excess nutrients from the river’s watershed. These nutrients originate in fertilizer and other lawn and farming products, as well as from livestock waste runoff.
As of 2023, PC scientists are studying the dynamic nature of hypoxia in Chandeleur Sound. Two stations are recording data at 15-min intervals to study how hypoxia sets up in the spring, how extensive it becomes and what factors might be responsible for the hypoxia itself.
As of 2023, PC scientists are studying the dynamic nature of hypoxia in Chandeleur Sound. Two stations are recording data at 15-min intervals to study how hypoxia sets up in the spring, how extensive it becomes and what factors might be responsible for the hypoxia itself.
Major Conclusions
While the size of the hypoxic area in these sounds vary on a yearly basis, it always appears north of the Chandeleur Islands and into the Cat Island Channel. Many factors seem to contribute to this dynamic process, including water quality, winds, tides, currents and rainfall. Each year, the development, expansion and disappearance of the hypoxic area tends to occur in areas cut off from prevailing currents in the Gulf. The cause of the formation of hypoxia may be a naturally induced phenomenon simply due to the lack of wind and wave energy during the summer. It does not appear that the development of bottom hypoxia east of the Mississippi River is driven by the input of excess nutrients, as it is for the Dead Zone. However, the exact cause of this hypoxia has not been found and study continues.
Bucktown Nursery
Bucktown Nursery
Our Bucktown Tree Nursery is currently home to over 5,000 native tree seedlings including bald cypress, water tupelo, green ash, and live oak. These seedlings will eventually be planted throughout the swamps Southeast Louisiana as part of our coastal reforestation program. We are seeking volunteer support to help maintain our nursery!
Thank You to Our Sponsors


Thank You to Our Partners


Our Work
Pontchartrain Conservancy’s programmatic areas work throughout the 16 parishes of the Pontchartrain Basin to advance our mission.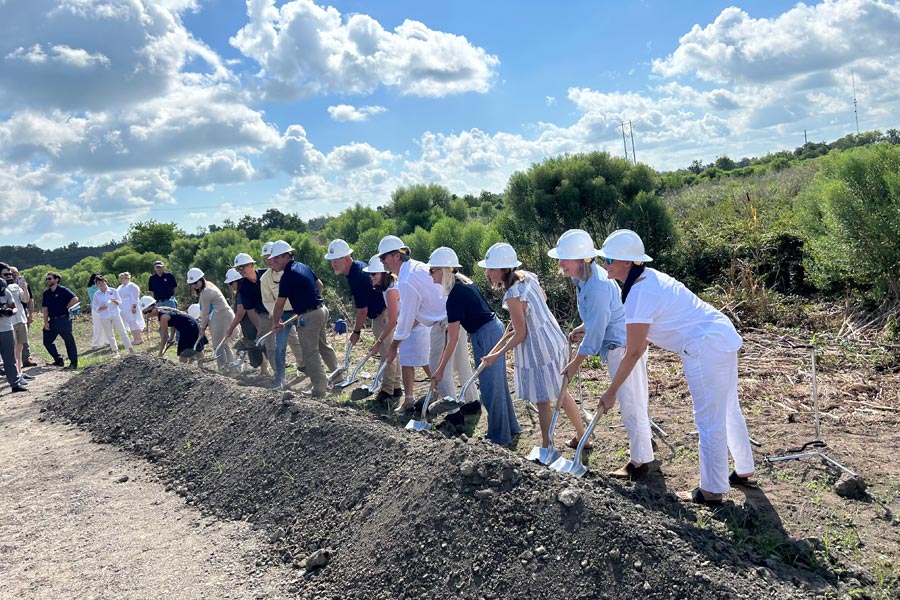
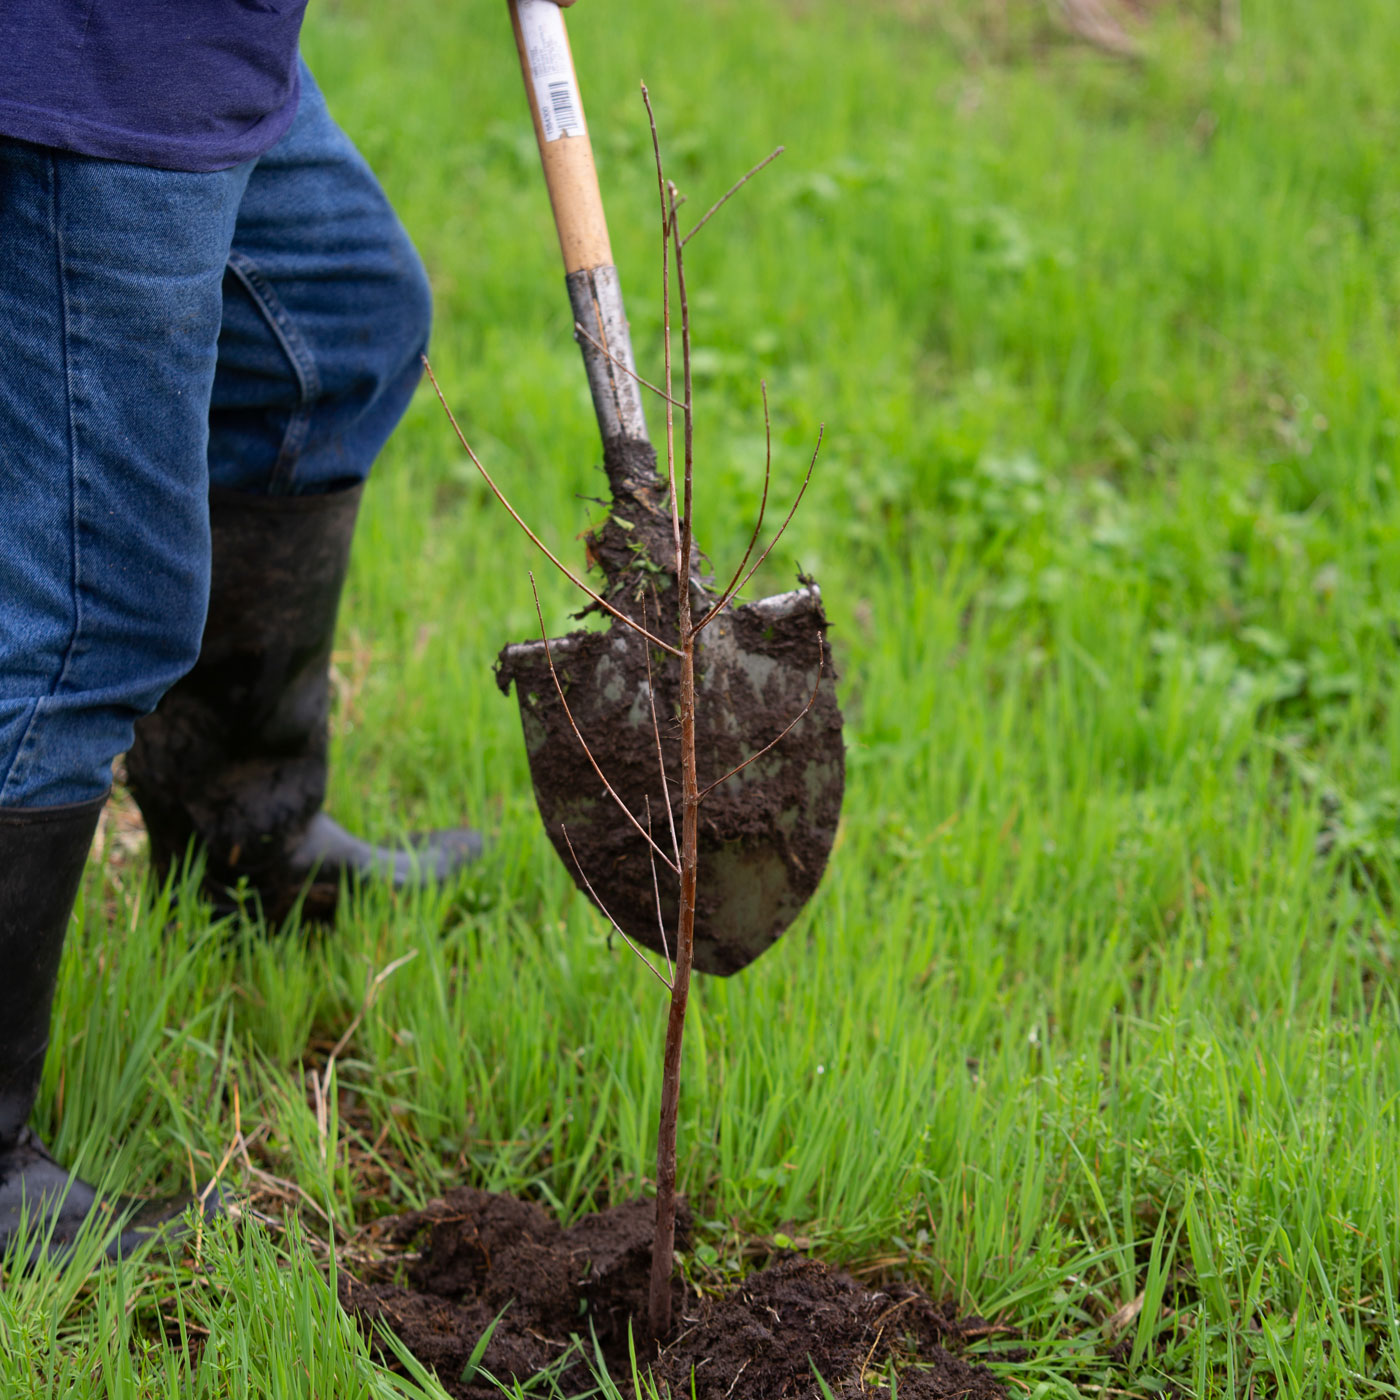
Get Involved
Discover the many ways you can contribute to save Southeast Louisiana. Take part in a tree planting, aid in gardening and instruction at our Lighthouse, or giveback in other ways. We need you today!
Support Our Work
By supporting Pontchartrain Conservancy, you have the opportunity to help save the Louisiana you know and love. Your support enables us to build a sustainable, prosperous, and resilient region together.