Filter These Results +
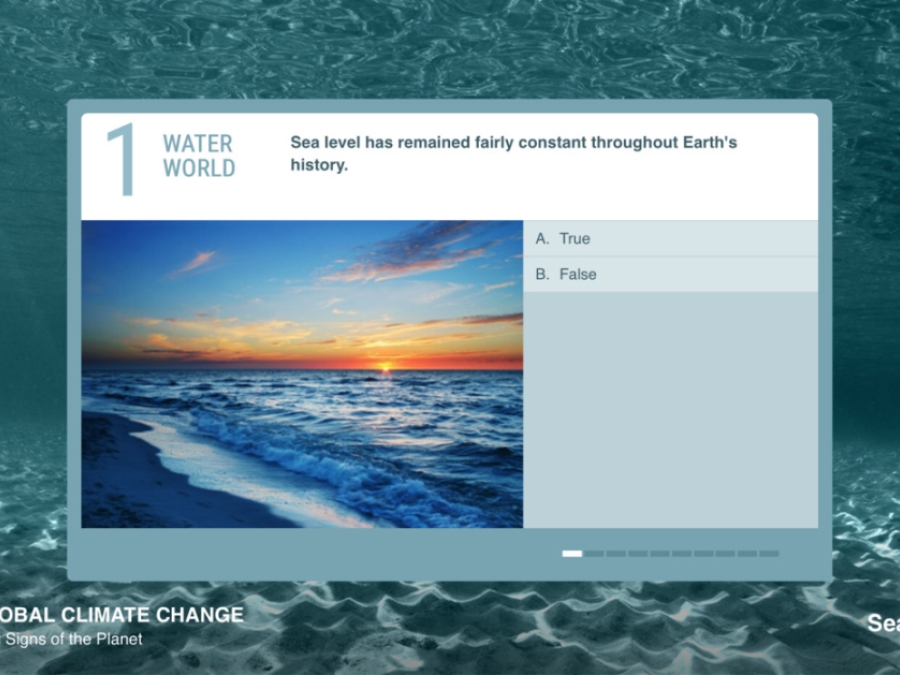
"Sea Change" Online Quiz
Use this quiz from NASA to "test your knowledge of sea level and its relation to climate change and our quality of life."
#Teamseas
#TeamSeas will be one of the biggest, baddest, most-impactful cleanup projects of all time - and here's how we're doing it. See our cutting-edge river Interceptors, info on locally-organized cleanups, ghost-gear removal efforts and professional expeditions to areas where we can have the greatest conservation impact!
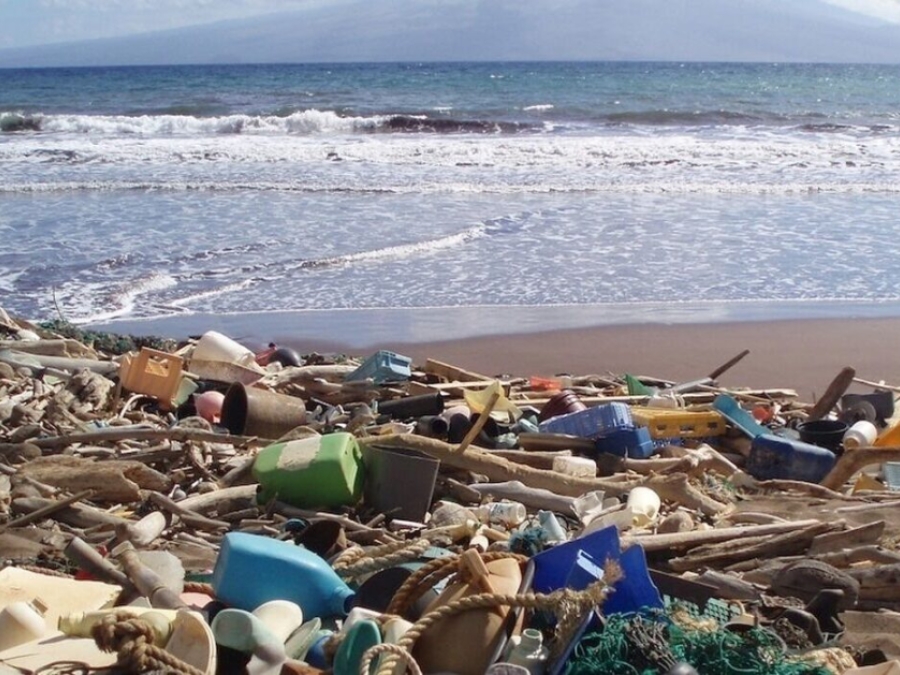
10 Most Common Types Of Beach Litter Are All Plastic
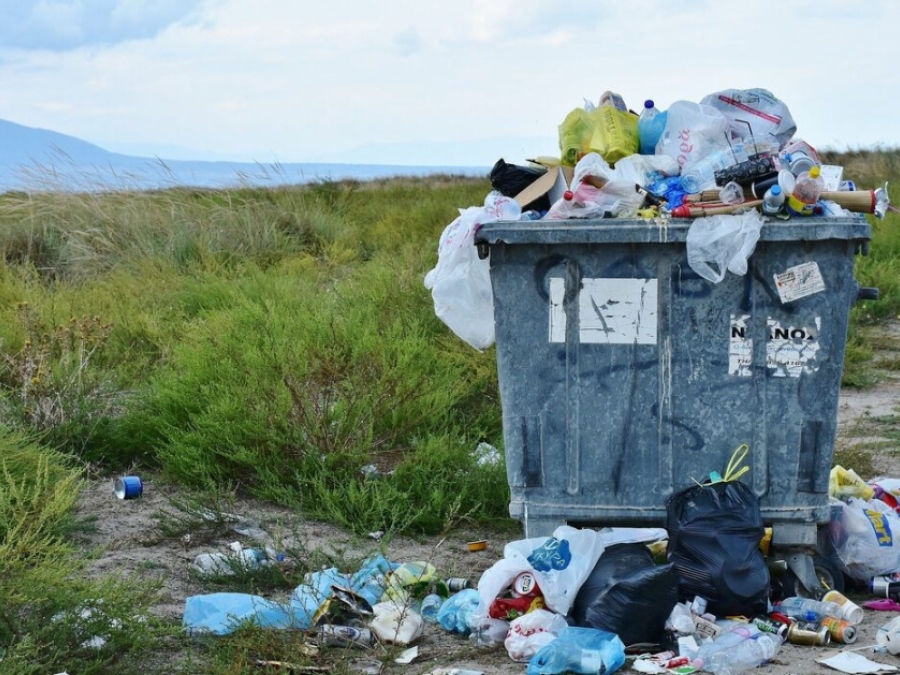
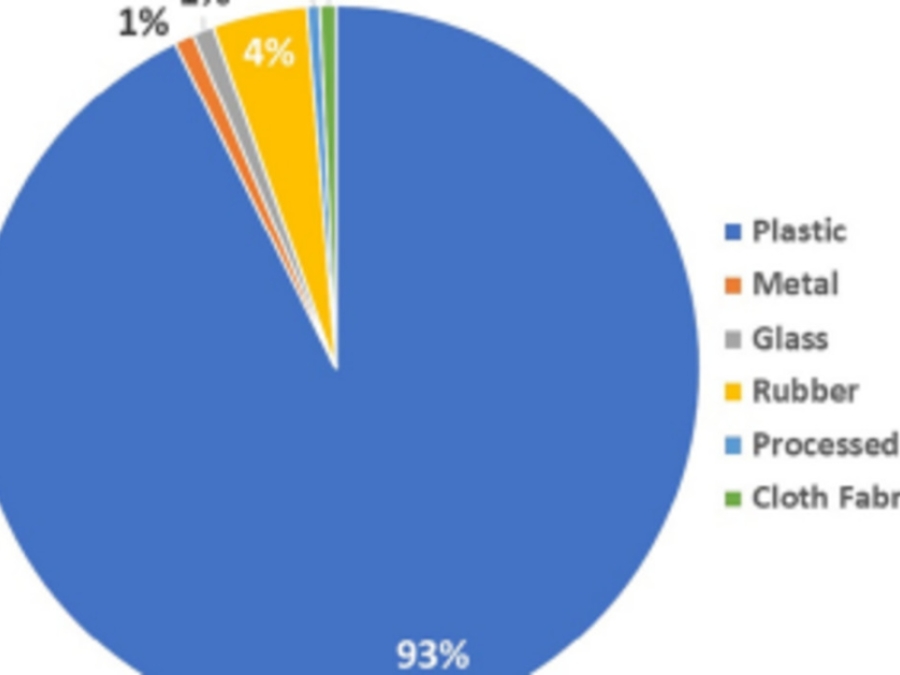
The Ocean Conservancy released on Wednesday its International Coastal Cleanup (ICC) report, a compilation of litter collected from a one-day cleanup of beaches and waterways worldwide. For the first time since the report's inception more than 30 years ago, the 10 most common items picked up by volunteers around the world were made of plastic. Foam takeaway containers booted glass beverage bottles from this year's list.
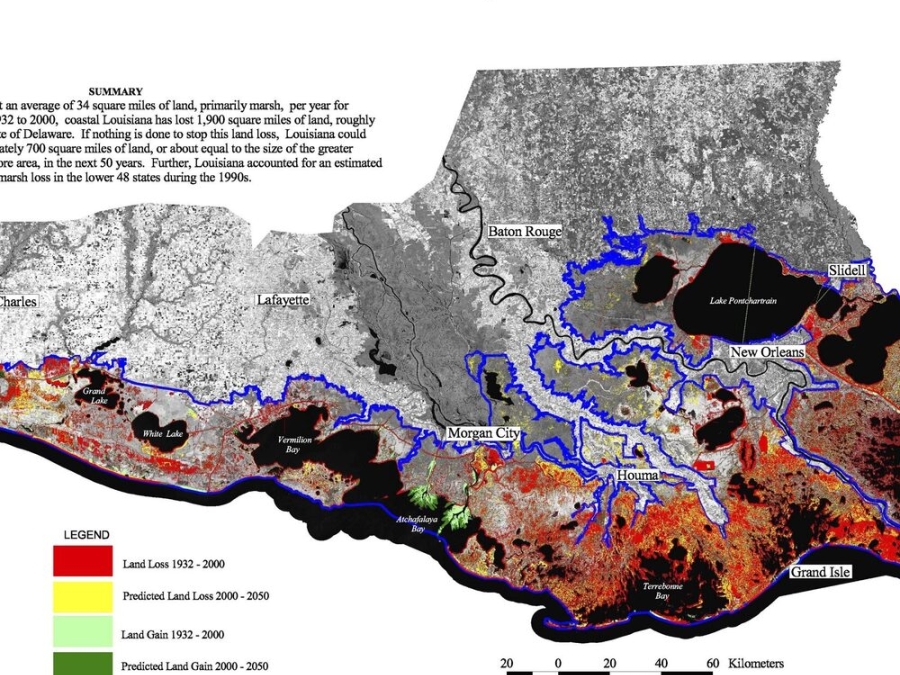
100+ Years Of Land Change
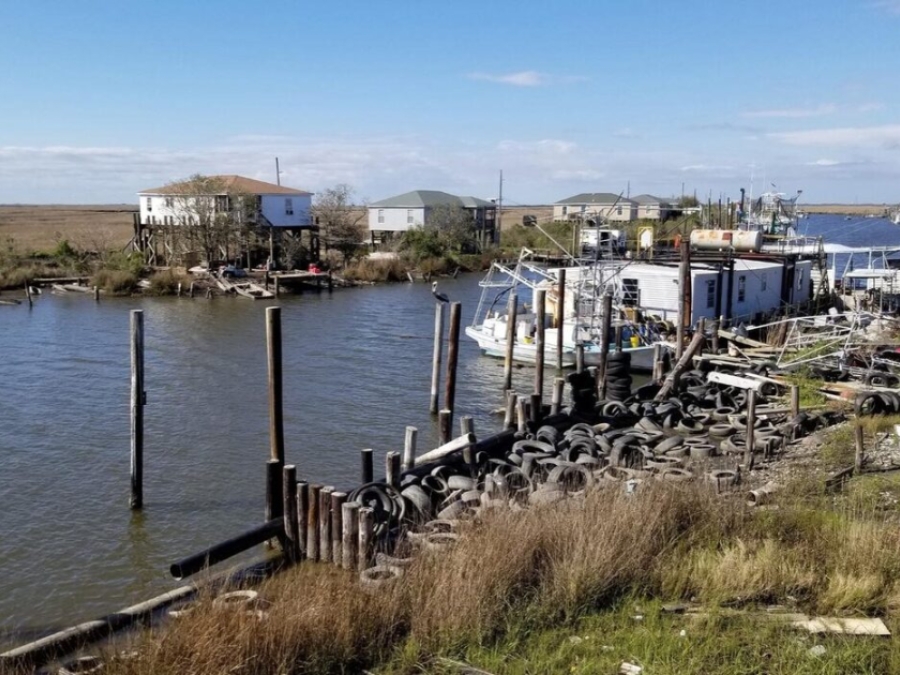
Coastal Louisiana has lost an average of 34 square miles of land, primarily marsh, per year for the last 50 years. From 1932 to 2000, coastal Louisiana has los 1,900 square miles of land, roughly an area the size of the state of Delaware. If nothing is done to stop this land loss, Louisiana could potentially lose approximately 700 square miles of land...in the next 50 years. Further, Louisiana accounted for an estimated 90 percent of the coastal marsh loss in the lower 48 states during the 1990s.
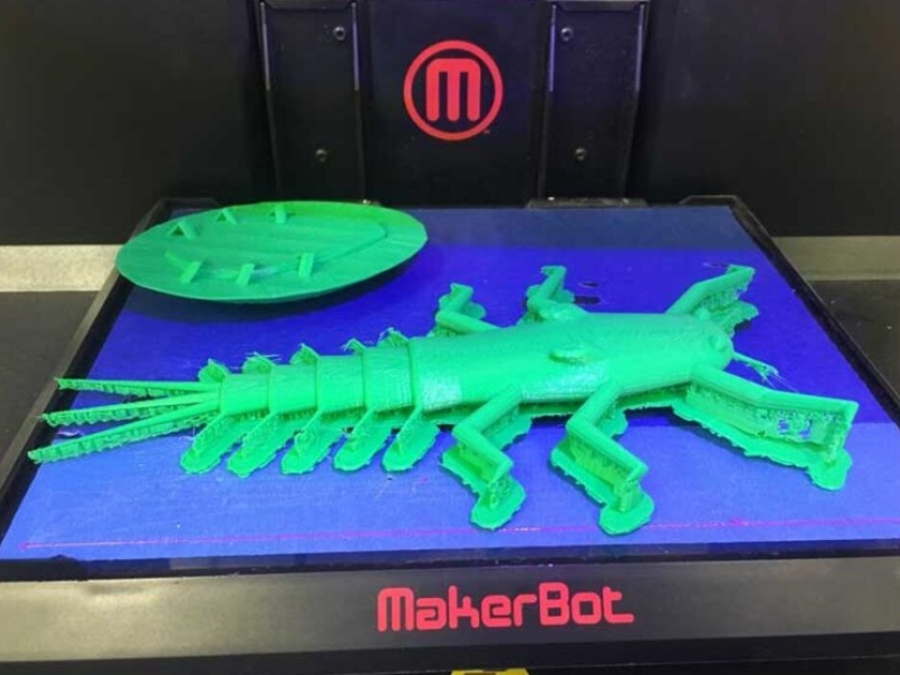
3D Printable Aquatic Macroinvertebrates
Learn more about the process behind creating 3D printer aquatic macroinvertebrate models. Plus, gain access to the files needed to print your own. In Orleans Parish, if you are in need of access to a 3D printer, check out Delgado Community College's FabLab!
7 Principles For Building Better Cities
More than half of the world's population already lives in cities, and another 2.5 billion people are projected to move to urban areas by 2050. The way we build new cities will be at the heart of so much that matters, from climate change to economic vitality to our very well-being and sense of connectedness. Peter Calthorpe is already at work planning the cities of the future and advocating for community design that's focused on human interaction. He shares seven universal principles for solving sprawl and building smarter, more sustainable cities.
A Brief History Of Plastic
For centuries, billiard balls were made of ivory from elephant tusks. But when excessive hunting caused elephant populations to decline, they began to look for alternatives. John Wesley Hyatt took up the challenge. In five years, he invented a new material called celluloid, which would become known as the first plastic. Trace the history of the material that ushered in the 'plastics century.'
A Culture Of Recycling
With support from a NOAA Marine Debris Community-based Removal Grant, the Mariana Islands Nature Alliance, expanded local waste management infrastructure by installing mixed-waste and recycling bins at seven locations on the island of Saipan.
A Framework For Climate Vulnerability Assessments
This guide is aimed at decision-makers, technical experts and civil society members interested in carrying out vulnerability assessments. Using experiences from India as a context, it provides guidance on conducting vulnerability assessments. It entails - next to an assessment methodology - a rich and comprehensive selection of methods and tools to assess the different components contributing to a system's vulnerability to climate change. The framework addresses key questions such as 'How to plan for a vulnerability assessment?', 'Which tools or methods to select to carry out a vulnerability assessment?' and 'How to carry out a vulnerability assessment?'.
A Glimpse Into A Restored Oyster Reef
The Paynter Lab at the University of Maryland conducts oyster reef surveys three years after restored reefs are planted with baby oysters, known as spat.
A Near-Decade After Bp Oil Spill, Now-Public Payout Claims Run Gamut- Including An Ex-Nba Star
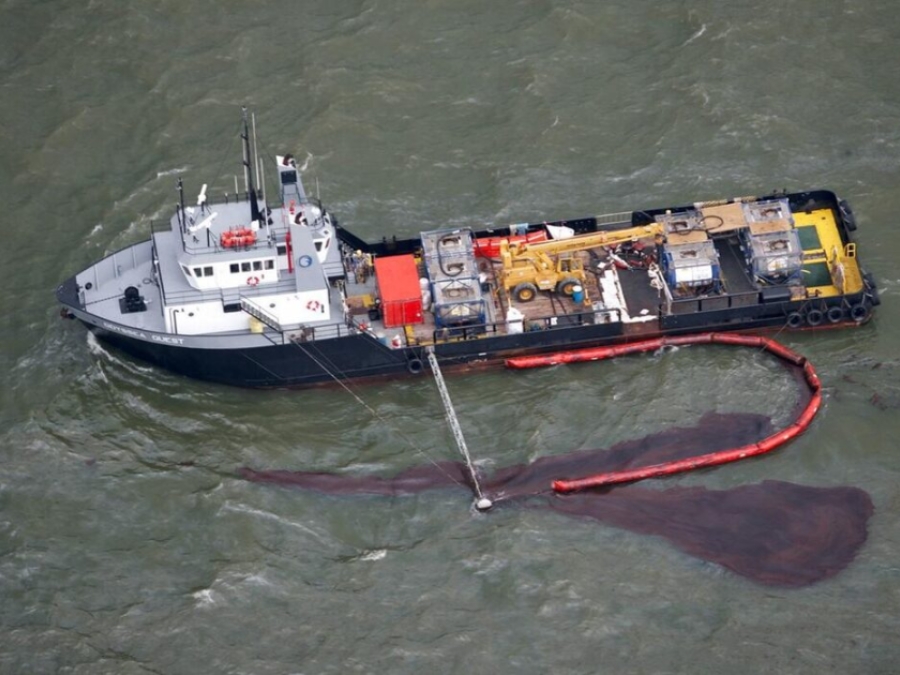
The environmental, economic and medical impacts of the 2010 oil spill sparked by the Deepwater Horizon disaster reached hundreds of miles inland to wreak complicated havoc on five Gulf states, and the cascades of litigation to follow were just as complex. Two months after the April 2010 spill, BP created what was known as the Gulf Coast Claims Facility to head off lawsuits. In exchange for a waiver of liability, the fund made quick cash payouts.
A Plastic Ocean
A Plastic Ocean documents the global effects of plastic pollution and highlights workable technologies and innovative solutions that everyone - from governments to individuals - can do, to create a cleaner and greener ocean.
A Running List Of Action On Plastic Pollution
The world is waking up to a crisis of ocean plastic - and we're tracking the developments and solutions as they happen. The world has a plastic pollution problem and it's snowballing - but so is public awareness and action. National Geographic magazine devoted a special cover package to plastic in June 2018. Here, we continue to track some of the developments around this important issue. We will update this article periodically as news develops.
A Speedy Test For Norovirus Could Help Water Supplies Check For Contamination
Norovirus tends to makes the news when an outbreak occurs on cruise ships. But the virus affects many more people than ocean-going vacationers. The Centers for Disease Control and Prevention estimates some 20 million people suffer acute intestinal illness from norovirus each year in this country. It's responsible for more than half of all cases of foodborne illness in the United States It can also get into municipal water supplies, when old pipes or storm overflow cause waste water contaminated with the norovirus to mix with drinking water.
A Twenty-First Cenury U.S. Water Policy, Water And Environmental Justice
The United States has remarkable water systems, developed over two centuries of technological, institutional, and economic advances. Yet the benefits of those systems have not been felt equally across regions, communities, or populations. And the adverse consequences of inadequate water quality or quantity, and the lack of responsiveness of some water institutions to community input and participation, have helped contribute to the growing environmental justice (EJ) effort to reform water policies based on respect and justice for all, free from discrimination, bias, or inequity. In communities from Detroit to New Orleans, the inner city to the tribal areas, efforts to understand and address EJ issues around water are beginning to take shape.
A Vanishing Island
In this lesson, students watch a film about a tiny island community off the Louisiana Coast and examine how coastal areas are impacted by the effects of climate change.
Accumulation And Distribution Of Marine Debris On Barrier Islands Across The Northern Gulf Of Mexico
In recent decades, the topic of marine debris has gained recognition as a significant global ecological and economic problem. As the amount of debris in our oceans grows, the frequency of research and monitoring to understand its sources, concentrations, and impacts also increases. As the frequency of studies grow, the evidence and understanding of the negative effects of marine debris does as well (Rochman et al., 2016). Debris has been documented to have a range of effects from individual organisms with ingestion and entanglement (Gall and Thompson, 2015), up to entire habitats and ecosystems.
Accumulation Survey Debris Datasheet
Accumulation studies provide information on the rate of deposition (flux) of debris onto the shoreline. These studies are more suited to areas that have beach cleanups, as debris is removed from the entire length of shoreline during each site visit. This type of survey is more labor-intensive and is used to determine the rate of debris deposition (# of items per unit area, per unit time).
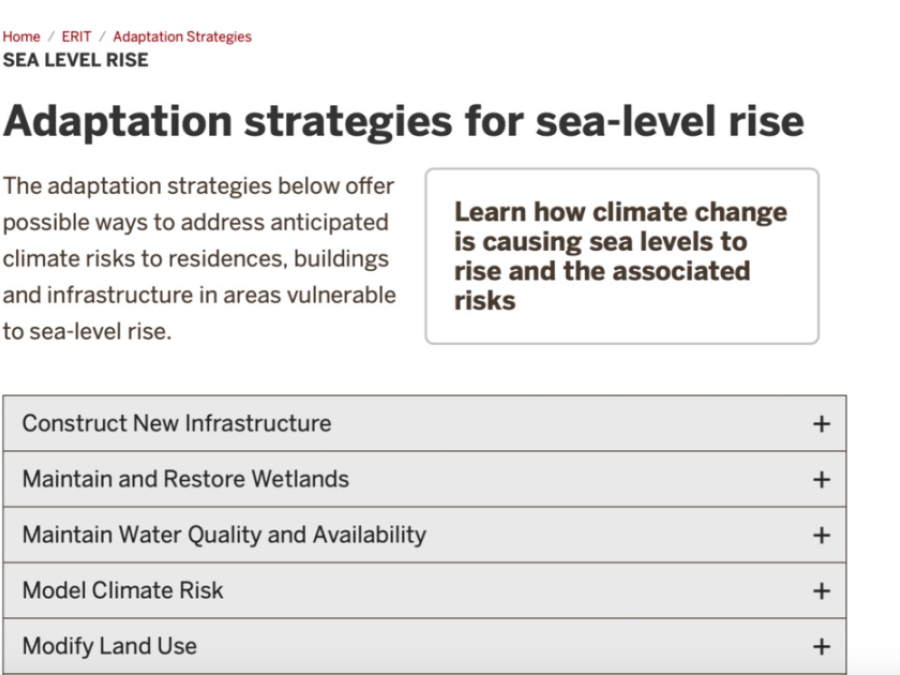
Adaptation Strategies For Sea-Level Rise
The[se] adaptation strategies offer possible ways to address anticipated climate risks to residences, buildings and infrastructure in areas vulnerable to sea-level rise.
Adapting Culture To Climate Change
This episode of Sea Grant's Voice of the Sea series explores the connection between culture and place and investigates how scientists, cultural practitioners, and community members are working together to understand and adapt to the effects of climate change.
Adopt-A- Catch Basin
With this resource, community members in New Orleans are invited to take part in stewardship by adopting a loca catch basin. "The City of New Orleans is working closely with residents and business owners to Adopt A Catch Basin on their block and help improve drainage conditions throughout the City. Eighty five percent of the City's clogged catch basins are full of leaves and grass clippings that can be easily and safely removed by residents like you!"
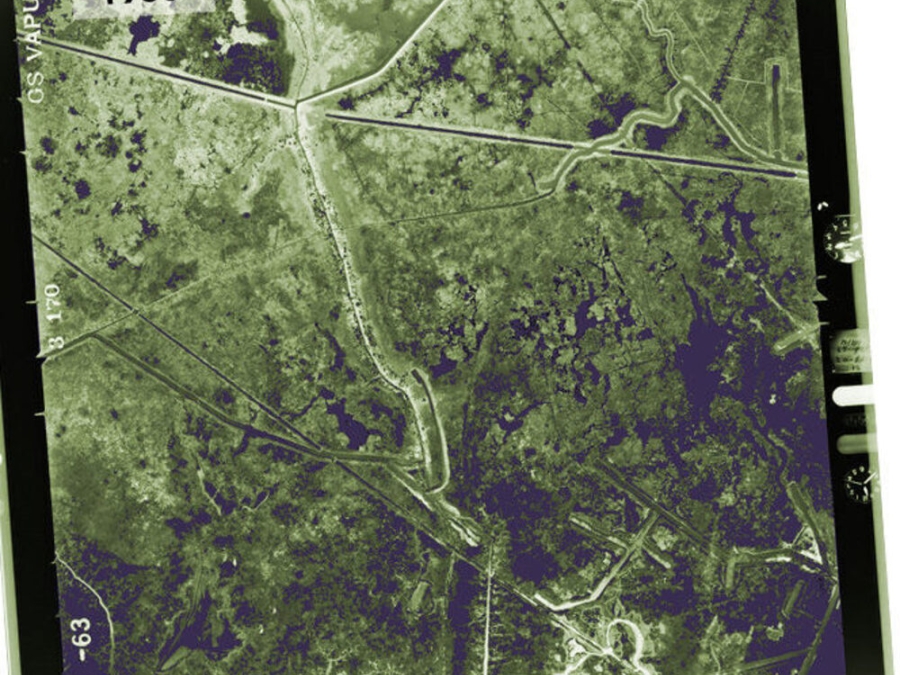
Aerial Photos: Isle De Jean Charles, La
Aerial photo of Isle de Jean Charles in 1963 from the USGS. Click for photos of Isle de Jean Charles in 1978, 1993, 1998, 2008, and 2010.
Aerial Seeding
In addition to restoration by volunteers, PC also utilizes aerial seeding techinques. If successful the seeds spread by airplane will grow into towering swamp trees, which will help to rebuild swamp habitat and will also protect surrounding communities from storm surge.
Agricultural Contaminants
Over the last 100 years, agricultural expansion and intensification has led to changes in water quality and the health of stream ecosystems. Considerable increases in fertilizer and pesticide use began in the 1960s. In 2010, about 11 billion kilograms of nitrogen fertilizer and 300 million kilograms of pesticides were used annually to enhance crop production or control pests. Increased levels of nutrients from fertilizers draining into streams can stimulate algal blooms and affect stream health and recreational uses of local streams, downstream reservoirs, and estuaries, and increase treatment costs for drinking water. Pesticides that are transported to streams can pose risks for aquatic life and fish-eating wildlife and drinking-water supplies.
Algae Spotted In Lake Pontchartrain
In this WDSU news segment from 2018, "the [Pontchartrain Conservancy] advises the public of algae bloom in the Northwest corner of Lake Pontchartrain."
All About Habs (Podcast)
Connect with ocean experts and explore topics from corals to coastal science with our audio podcast." This episode focuses on uncovering the mystery of harmful algal blooms
Alliance For Climate Education
A comprehensive website that includes videos, campaigns, and information for "Educating high school students about climate change and empowering them to lead on climate solutions."
American Geoscience Institute- Water Quality
AGI's Water Quality website provides a host of information about different water and water quality topics.
An Educator's Guide To Marine Debris
Despite its prevalence, marine debris is a problem that each individual citizen can help prevent. Education is the first crucial step in mitigation. Through the use of this guide, we can help foster environmental stewardship and create advocates for the marine environment. With every person that participates in a cleanup, uses a reusable bag or water bottle, or spreads the word about marine debris, we move one step closer to creating a more beautiful and healthy marine environment.
An Educator's Guide To The Meaningful Watershed Educational Experience
Meaningful Watershed Educational Experiences (MWEEs) are learner-centered experiences that actively engage students in building knowledge and meaning through hands-on investigation of local environmental issues." This guide is designed to help educators plan, evaluate, and sustain MWEEs
An Introduction To Land Conservation Agreements
Land Conservation Agreements limit a property's uses in order to protect its conservation values. This enhanced or permanent protection of corporate lands can help conserve the natural, scenic, or rural qualities of the land for today and for future generations, adding to the depth of your Conservation Certification goals. Join Sylvia Bates of the Land Trust Alliance to explore the basics of conservation agreements. You'll also hear case studies of successful corporate and land trust partnerships.
An Introduction To Living Shorelines
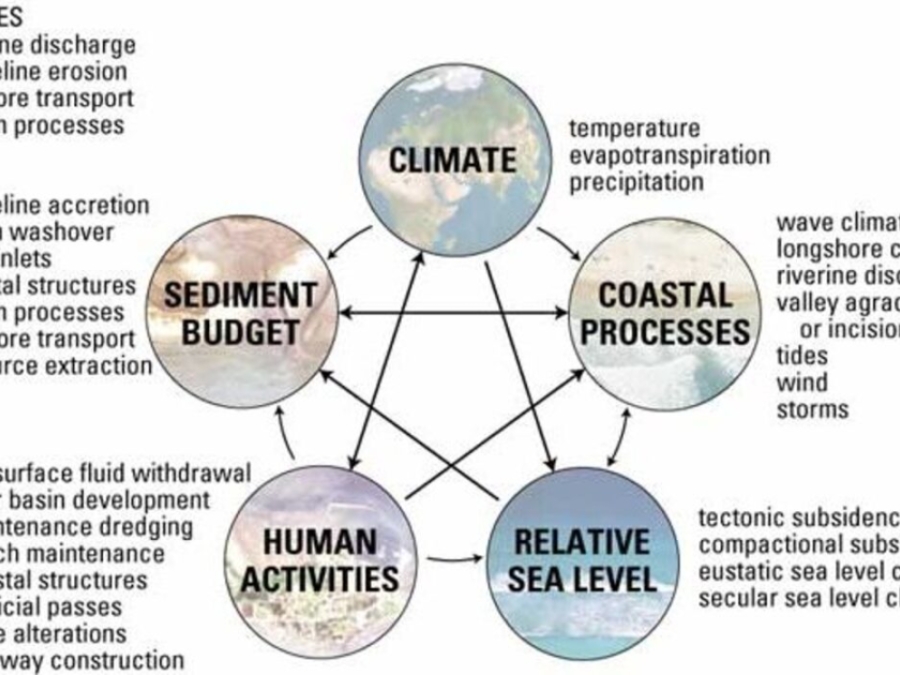
Living shorelines' is a term used to define a number of shoreline protection options that allow for natural coastal processes to remain through the strategic placement of plants, stone, sand fill, and other structural and organic materials.The goal is to retain much of the wind, tide, and storm-related wave protection of a hard structure, while maintaining some of the features of natural shorelines.
An Overview Of Coastal Land Loss: With Emphasis On The Southeastern United States
This report represents a general overview of the primary causes and consequences of coastal land loss. Most of the examples and references are from states bordering the Gulf of Mexico and the Atlantic Ocean where the largest magnitudes and highest rates of coastal land losses in the United States are recorded (Dahl, 2000). The report serves as an introductory guide to the topics and literature on coastal land loss, and acts as a link to ongoing research being conducted by the U.S. Geological Survey.
Analysis Of Marine Debris
Drawing on decades of experience in marine and coastal pollution research, Australia's Commonwealth Scientific and Industrial Research Organization (CSIRO) undertook a collaborative project with Ocean Conservancy (OC) and the National Oceanic and Atmospheric Administration Marine Debris Program (NOAA MDP) to better understand marine debris within the United States.
Analysis Of Online Water Quality Data
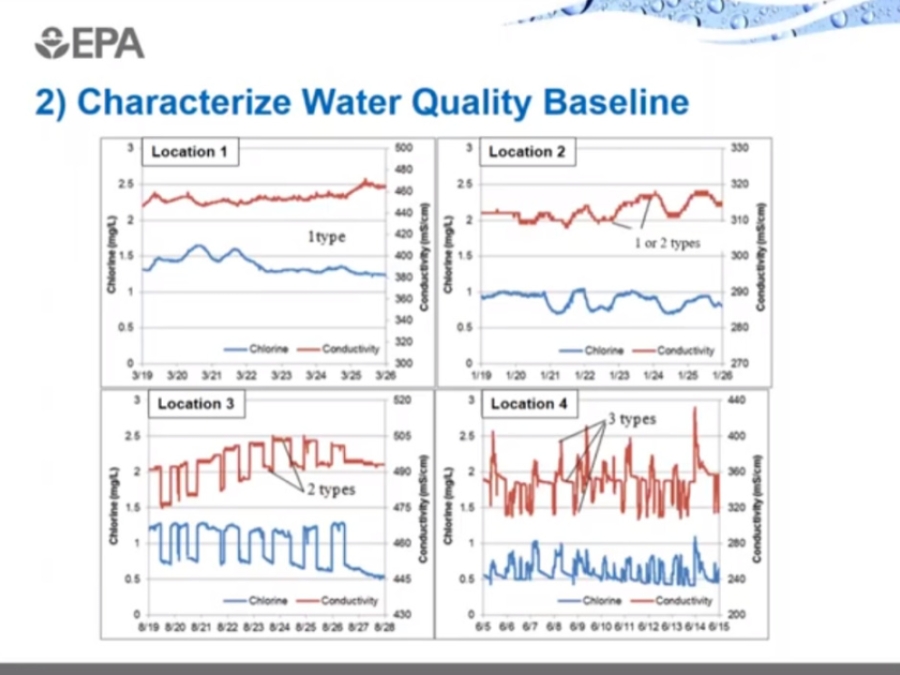
This video describes methods for conducting an exploratory analysis of historical water quality data collected from a water distribution system using online monitoring instruments. It also describes how source water constituents of concern can be estimated in near-real-time using continuous water-quality data.
Are Microplastics A Macropromblem?
Although trash heaps are easier to spot in waterways, microplastics - pieces of plastic smaller than five millimeters - have started to stir more concern. Acting as sponges, the pieces soak up the chemicals around them and often make their way through the food chain, ending up on dinner plates. Most microplastics are created over time from larger pieces or directly from microbeads in products like face washes or toothpaste.
As Sea Level Rise Threatens Their Ancestral Village, A Louisiana Tribe Fights To Stay Put
Ten years ago, as news of the BP oil disaster reached Louisiana's Grand Bayou Indian Village, Rosina Philippe dispatched her brother Maurice Phillips on a reconnaissance mission. Phillips pointed his flatboat toward the Gulf of Mexico and motored through a series of canals and inlets until he reached a fertile fishing ground called Bay Jimmy, eight miles from home. He returned with a passenger: a brown pelican, alive but slathered in petroleum. Philippe and her brother belong to the Atakapa-Ishak/Chawasha Tribe. They live in their ancestral village, an hour's drive south of New Orleans near the town of Port Sulphur. Most of the tribe's estimated 400 members live elsewhere, but a remnant remains in Grand Bayou, a community that has shrunk over the years as its land has slowly slipped into the surrounding waters.
At Home With Mote
Seagrass meadows are vital to a healthy ocean and a healthy planet but are faced with big problems. Join us as we explore these bustling secret gardens of the sea and learn how we can practice citizen science to help conserve them. Be sure to check out the Pre-Lesson Activity guide so you can find animals, identify species of seagrass and simulate how scientists study this unique environment with us!
Babylegs
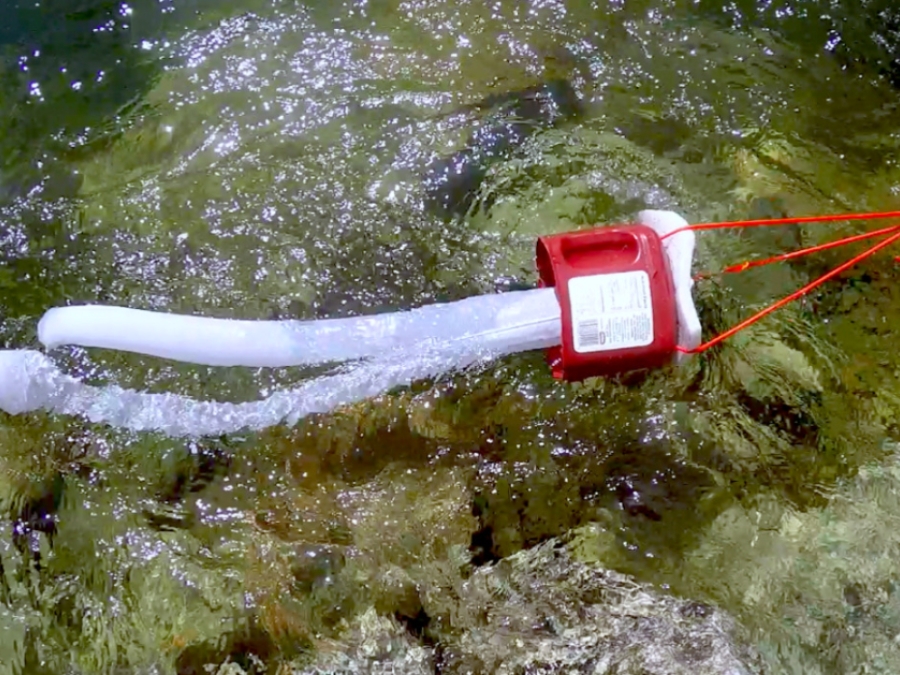
Created with baby's tights, soda pop bottles, and other inexpensive and easy to find materials, Babylegs can be used to trawl for floating marine microplastics from a boat (motorized or hand-propelled). It is designed to mimic the type of samples collected by the more expensive Manta Trawl: floating microplastics less than 5mm in size. BabyLegs usually requires trawl times of 20 minutes to an hour, so is not appropriate for use by hand. If you do not have a boat and would like to check local waters for plastics, we recommend the Ice Cream Scoop, or a shoreline study.
Banking On The Impossible: The Political Life Of Wetlands In Southern Louisiana
Wetland banking is an increasingly prominent environmental governance strategy in the United States. Associated with larger trends toward the financialization of ecosystem services, wetland banking acts as a mode of social regulation while stabilizing a particular regime of accumulation. Its use by the Army Corps of Engineers and the Environmental Protection Agency to regulate the development of wetlands has certain implications for the distribution of and access to land, water, and capital. This thesis investigates a particular wetland development project in southeastern Louisiana and its relation to a local wetland bank, the Army Corps of Engineers, and a multinational oil company. This thesis concludes that wetland banking as an environmental governance strategy reproduces a system of uneven development and environmental injustice.
Bay Backpack Teaching Resources
Teaching environmental issues in your classroom is a critical component of providing your students a Meaningful Watershed Educational Experience (MWEE). Discover a wealth of environment-related books, multimedia, curriculum guides, individual lesson plans and online data sources
Beacon 2.0
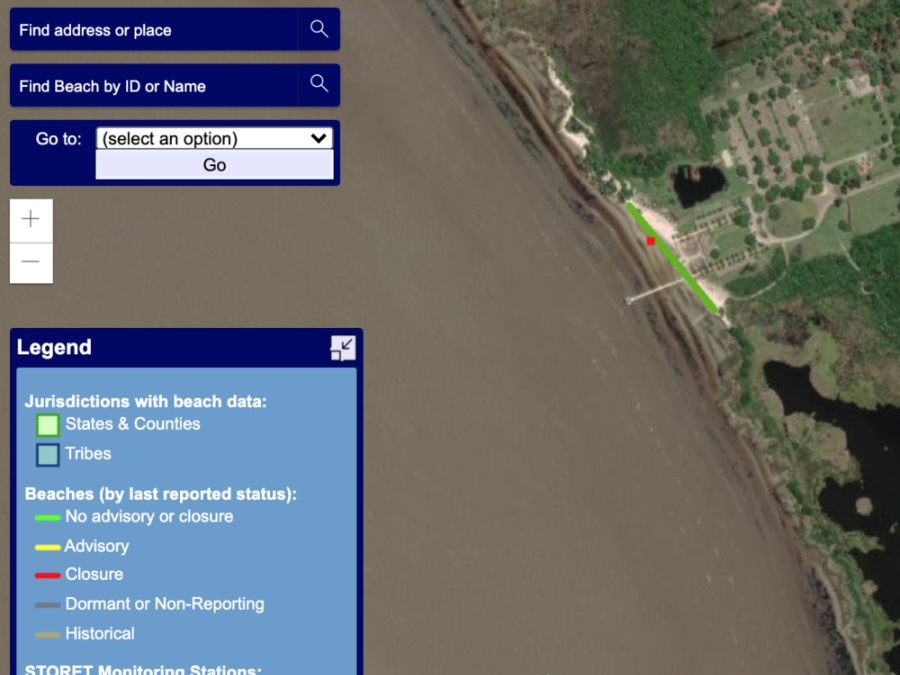
Under the Beaches Environmental Assessment and Coastal Health (BEACH) Act of 2000, EPA provides annual grants to coastal and Great Lakes states, territories, and eligible tribes to help local authorities monitor their coastal and Great Lakes beaches and notify the public of water quality conditions that may be unsafe for swimming.
Blue Carbon: How Seagrass Is Our Ocean's Wonder Plant And Their Role In Fighting Climate Change
Blue carbon ecosystems like seagrass meadows play a huge role in fighting climate chaos. We call on national governments to recognise the critical importance of our ocean and blue carbon in the fight against the climate emergency. .
Brand Audit Toolkit
Break Free From Plastic is taking litter cleanups a step further by documenting the brands found on plastic waste collected at a cleanup. This helps us identify the companies responsible for plastic pollution. To truly solve the plastic problem, we are calling on these companies to stop producing so much unnecessary single-use plastic in the first place.
Break Free From Plastics
The #breakfreefromplastic Movement is a global movement envisioning a future free from plastic pollution. Since its launch in 2016, more than 8,000 organizations and individual supporters from across the world have joined the movement to demand massive reductions in single-use plastics and to push for lasting solutions to the plastic pollution crisis.
Bringing The Vlei Back To Life
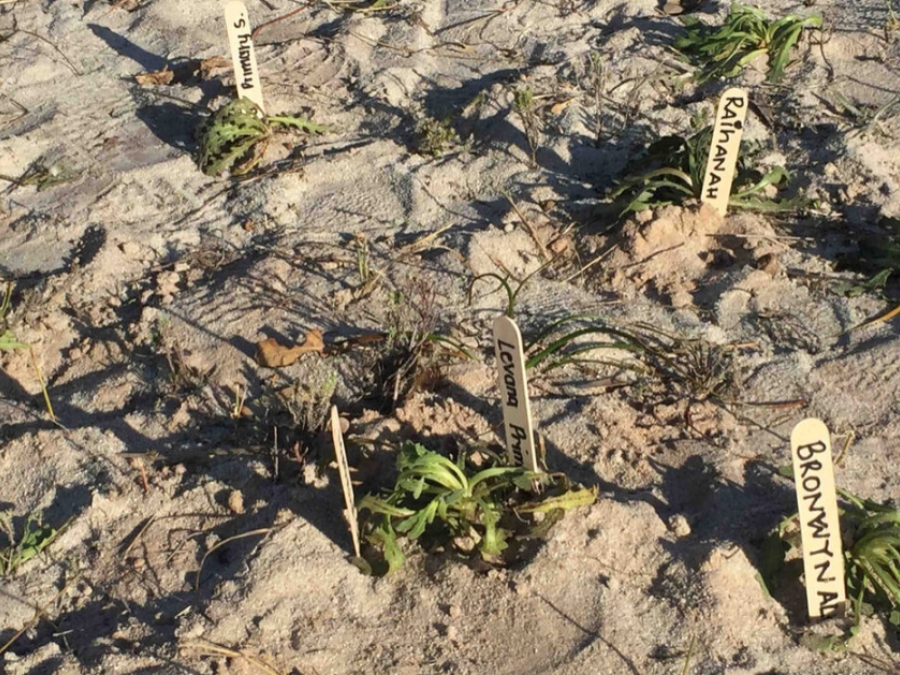
The Princess Vlei restoration project Growing Conservation Communities seeks to ignite community led conservation to restore critical habitats in the Greater Princess Vlei Conservation Area. It is projected to encompass the largest community led mass-planting event in the Greater Cape Floristic Region. While planting has been happening for ten years, the scope and rigour of this restoration plan takes the process to a new level." Information about the Princess Vlei Restoration Project can also be found on the Society for Ecological Restoration website
Bsj Water Data- Inside The Gate
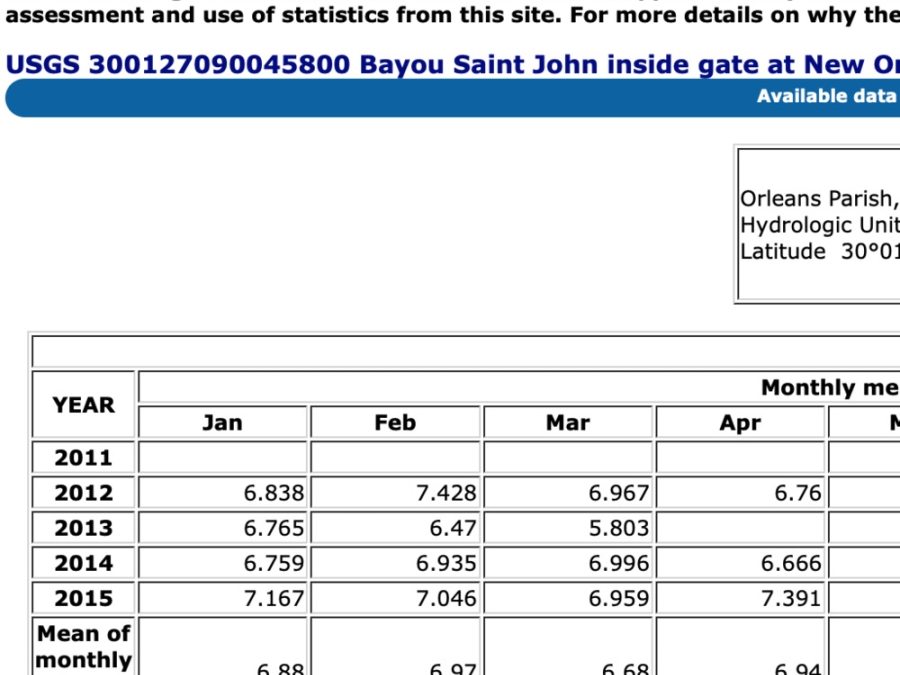
Water data for Bayou St. John (inside the gate) from 2011 to 2015.


